Arlington County, Virginia Nativity & Citizenship Status (2024)
Place of birth and citizenship status analysis for Arlington County, Virginia
Arlington County, Virginia Nativity & Citizenship Indicators (2024)
Native Born
77.6%
Foreign Born
22.4%
Naturalized
11.0%
US Citizens
88.6%
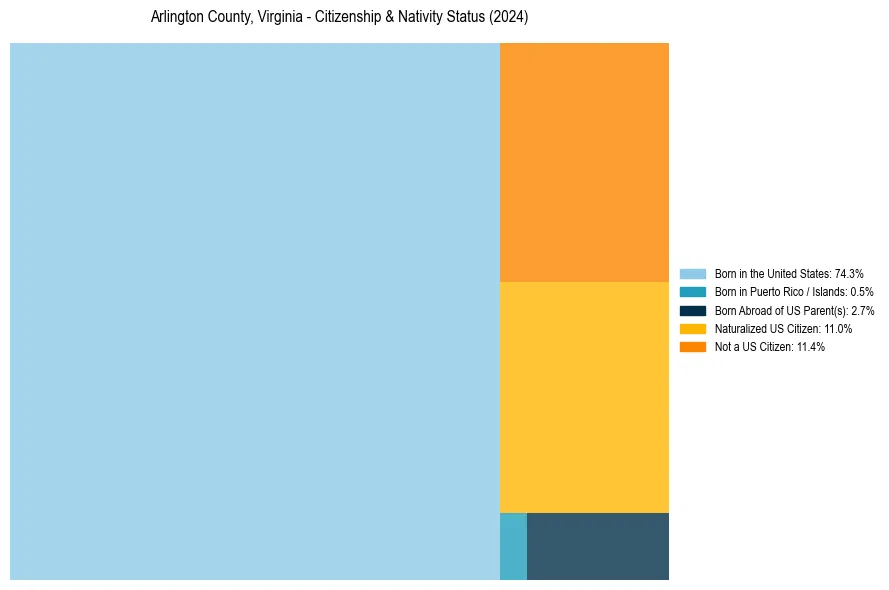
Arlington County, Virginia Nativity & Citizenship Distribution
Arlington County, Virginia Historical Nativity Trends (2010–2024)
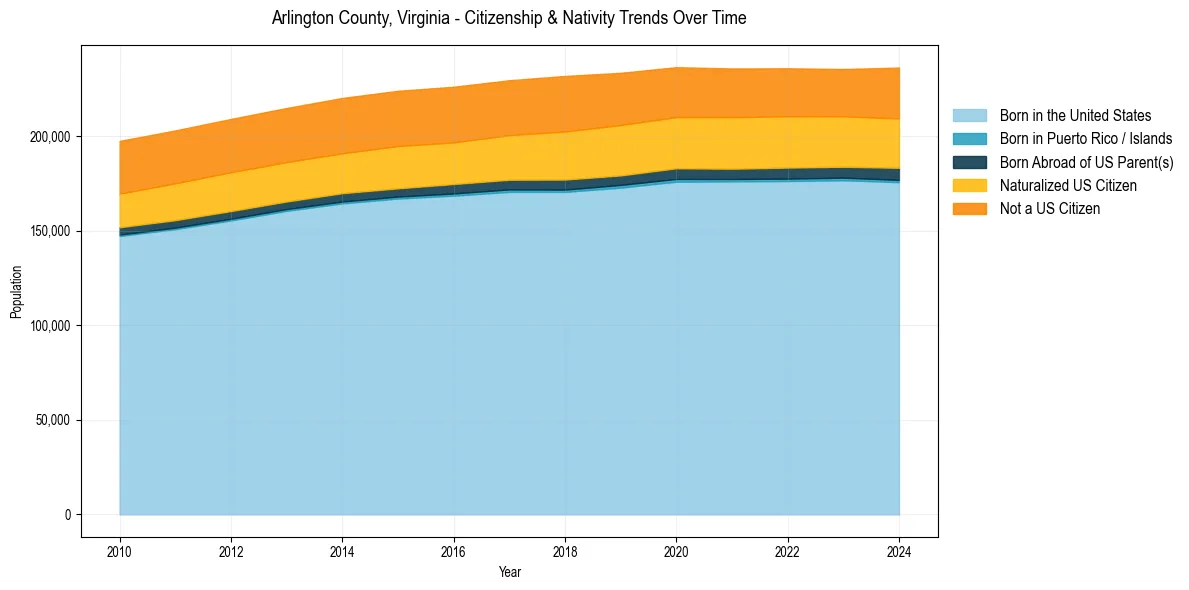
Arlington County, Virginia Population & Nativity History
| Year | Total Pop | Foreign Born | Native Born |
|---|---|---|---|
| 2024 | 236,254 | 22.4% | 77.6% |
| 2023 | 235,463 | 21.9% | 78.1% |
| 2022 | 235,845 | 22.3% | 77.7% |
| 2021 | 235,764 | 22.5% | 77.5% |
| 2020 | 236,434 | 22.6% | 77.4% |
| 2019 | 233,464 | 23.2% | 76.8% |
| 2018 | 231,803 | 23.6% | 76.4% |
| 2017 | 229,534 | 22.9% | 77.1% |
| 2016 | 226,092 | 22.7% | 77.3% |
| 2015 | 223,945 | 23.0% | 77.0% |
| 2014 | 220,173 | 22.9% | 77.1% |
| 2013 | 214,861 | 23.0% | 77.0% |
| 2012 | 209,077 | 23.3% | 76.7% |
| 2011 | 202,999 | 23.4% | 76.6% |
| 2010 | 197,467 | 23.1% | 76.9% |
Nativity & Citizenship FAQs for Arlington County, Virginia
Approximately 22.4% of residents in Arlington County, Virginia were born outside the United States.
The vast majority of residents, roughly 88.6%, are U.S. citizens (including both native-born and naturalized citizens).