Fairfax County, Virginia Nativity & Citizenship Status (2024)
Place of birth and citizenship status analysis for Fairfax County, Virginia
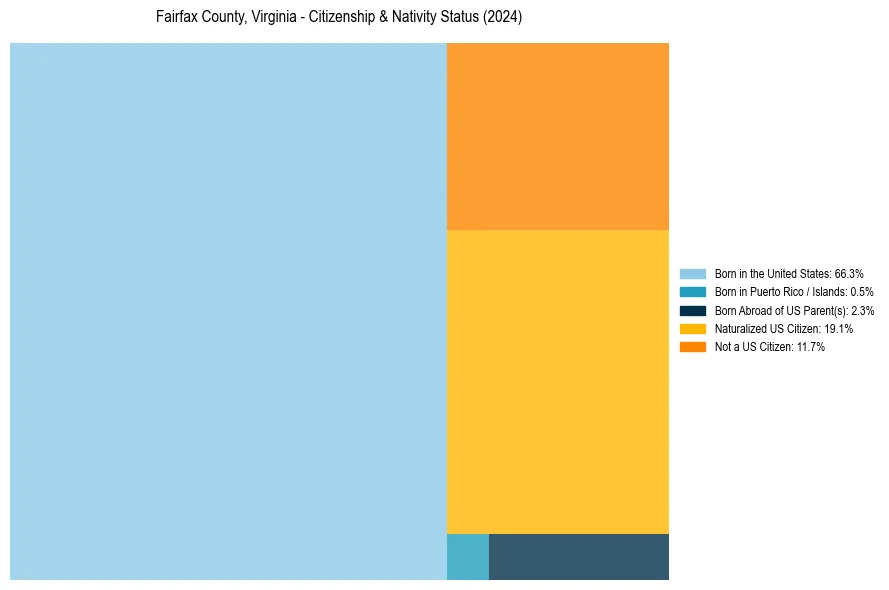
Fairfax County, Virginia Nativity & Citizenship Indicators (2024)
Native Born
69.2%
Foreign Born
30.8%
Naturalized
19.1%
US Citizens
88.3%
Fairfax County, Virginia Nativity & Citizenship Distribution
Fairfax County, Virginia Historical Nativity Trends (2010–2024)
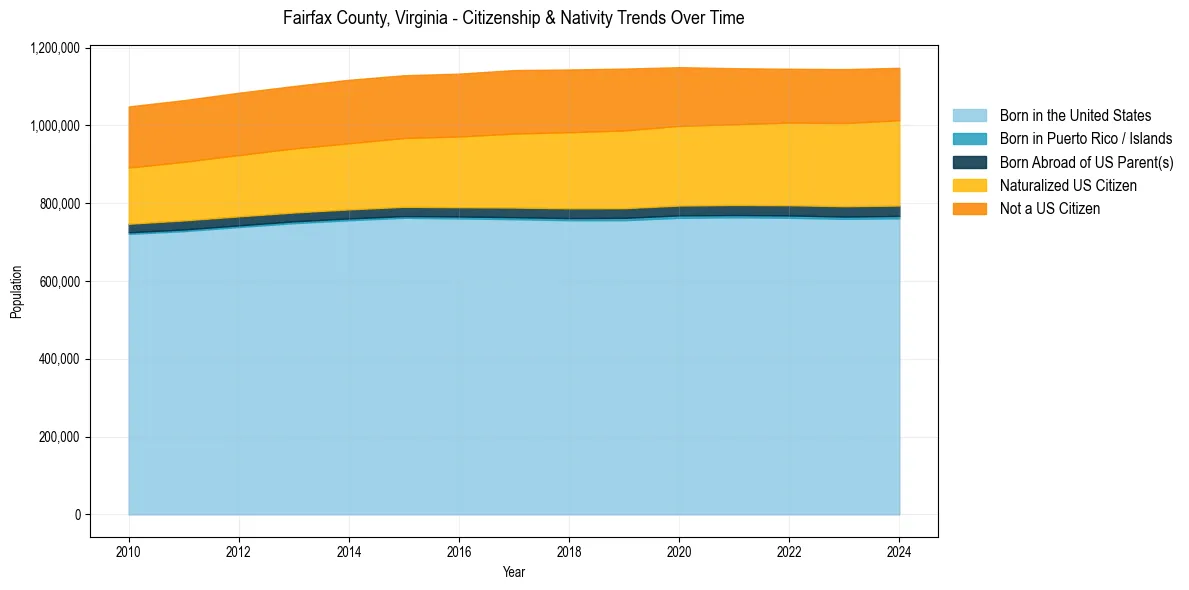
Fairfax County, Virginia Population & Nativity History
| Year | Total Pop | Foreign Born | Native Born |
|---|---|---|---|
| 2024 | 1,147,837 | 30.8% | 69.2% |
| 2023 | 1,144,474 | 30.8% | 69.2% |
| 2022 | 1,145,354 | 30.6% | 69.4% |
| 2021 | 1,146,825 | 30.6% | 69.4% |
| 2020 | 1,149,439 | 30.9% | 69.1% |
| 2019 | 1,145,862 | 31.3% | 68.7% |
| 2018 | 1,143,529 | 31.2% | 68.8% |
| 2017 | 1,142,004 | 30.9% | 69.1% |
| 2016 | 1,132,887 | 30.3% | 69.7% |
| 2015 | 1,128,722 | 30.0% | 70.0% |
| 2014 | 1,117,072 | 29.8% | 70.2% |
| 2013 | 1,101,071 | 29.5% | 70.5% |
| 2012 | 1,083,770 | 29.3% | 70.7% |
| 2011 | 1,064,735 | 29.0% | 71.0% |
| 2010 | 1,048,554 | 28.8% | 71.2% |
Nativity & Citizenship FAQs for Fairfax County, Virginia
Approximately 30.8% of residents in Fairfax County, Virginia were born outside the United States.
The vast majority of residents, roughly 88.3%, are U.S. citizens (including both native-born and naturalized citizens).