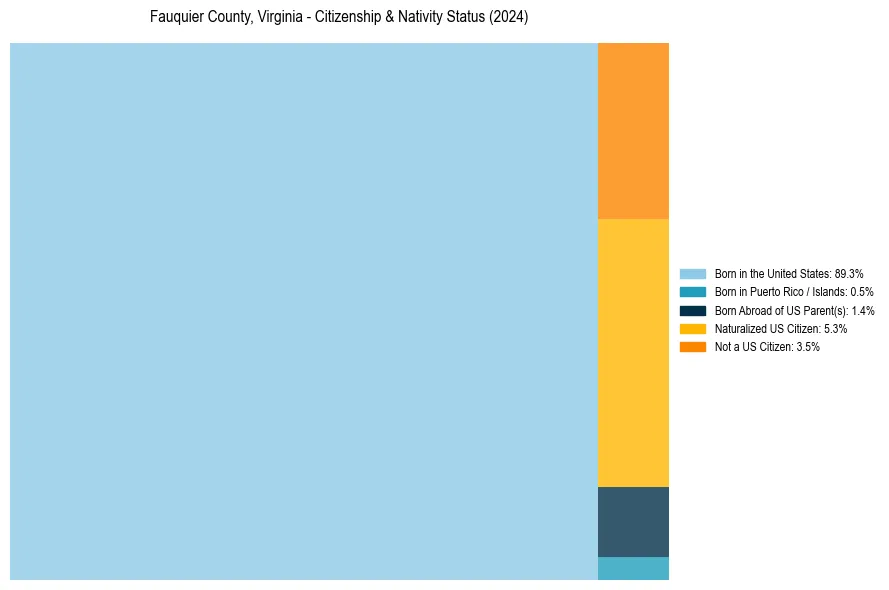
Fauquier County, Virginia Nativity & Citizenship Status (2024)
Place of birth and citizenship status analysis for Fauquier County, Virginia
Fauquier County, Virginia Nativity & Citizenship Indicators (2024)
Native Born
91.1%
Foreign Born
8.9%
Naturalized
5.3%
US Citizens
96.5%
Fauquier County, Virginia Nativity & Citizenship Distribution
Fauquier County, Virginia Historical Nativity Trends (2010–2024)
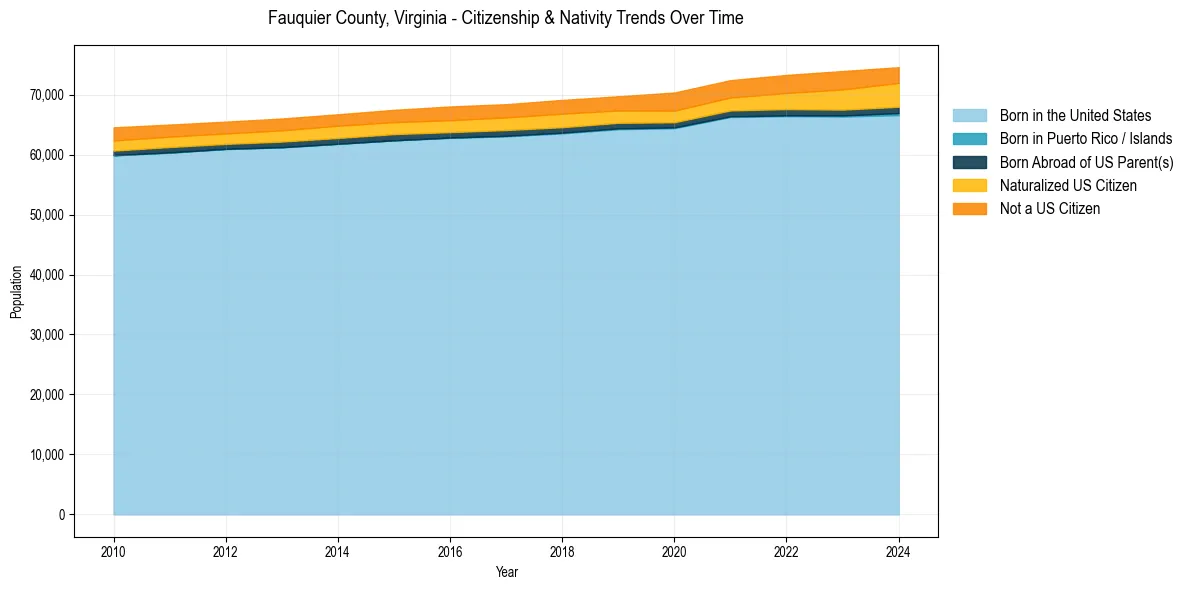
Fauquier County, Virginia Population & Nativity History
| Year | Total Pop | Foreign Born | Native Born |
|---|---|---|---|
| 2024 | 74,577 | 8.9% | 91.1% |
| 2023 | 73,935 | 8.7% | 91.3% |
| 2022 | 73,290 | 7.8% | 92.2% |
| 2021 | 72,416 | 7.0% | 93.0% |
| 2020 | 70,353 | 7.1% | 92.9% |
| 2019 | 69,728 | 6.4% | 93.6% |
| 2018 | 69,115 | 6.6% | 93.4% |
| 2017 | 68,406 | 6.3% | 93.7% |
| 2016 | 68,025 | 6.3% | 93.7% |
| 2015 | 67,463 | 6.0% | 94.0% |
| 2014 | 66,726 | 5.9% | 94.1% |
| 2013 | 66,015 | 5.8% | 94.2% |
| 2012 | 65,495 | 5.7% | 94.3% |
| 2011 | 65,008 | 5.8% | 94.2% |
| 2010 | 64,546 | 6.0% | 94.0% |
Nativity & Citizenship FAQs for Fauquier County, Virginia
Approximately 8.9% of residents in Fauquier County, Virginia were born outside the United States.
The vast majority of residents, roughly 96.5%, are U.S. citizens (including both native-born and naturalized citizens).