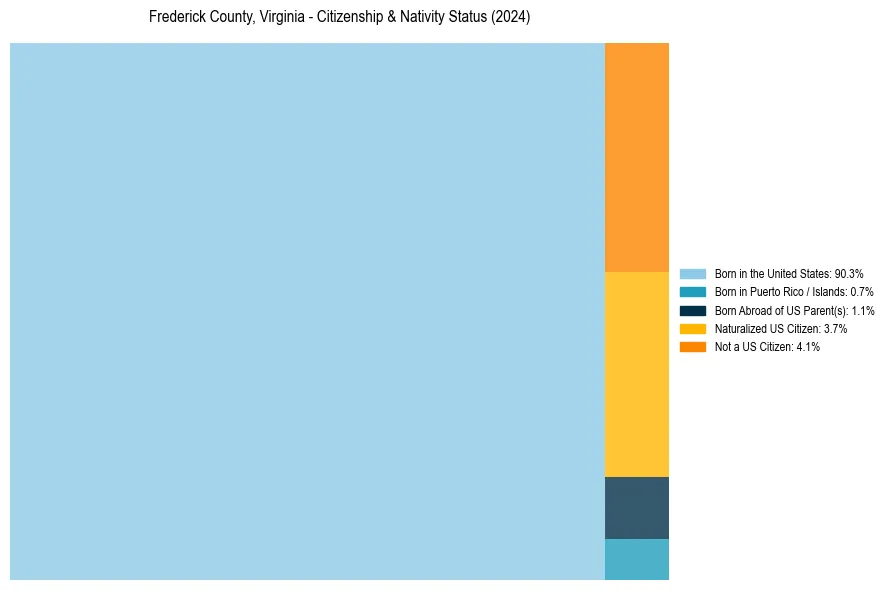
Frederick County, Virginia Nativity & Citizenship Status (2024)
Place of birth and citizenship status analysis for Frederick County, Virginia
Frederick County, Virginia Nativity & Citizenship Indicators (2024)
Native Born
92.2%
Foreign Born
7.8%
Naturalized
3.7%
US Citizens
95.9%
Frederick County, Virginia Nativity & Citizenship Distribution
Frederick County, Virginia Historical Nativity Trends (2010–2024)
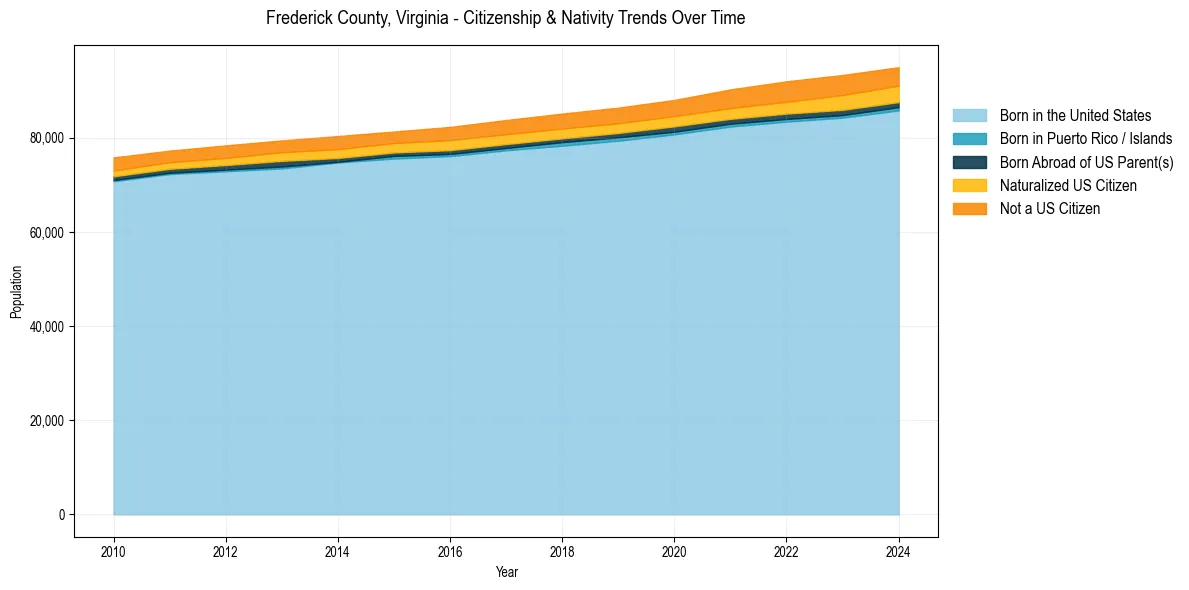
Frederick County, Virginia Population & Nativity History
| Year | Total Pop | Foreign Born | Native Born |
|---|---|---|---|
| 2024 | 95,008 | 7.8% | 92.2% |
| 2023 | 93,355 | 7.9% | 92.1% |
| 2022 | 92,007 | 7.5% | 92.5% |
| 2021 | 90,287 | 6.9% | 93.1% |
| 2020 | 88,054 | 6.4% | 93.6% |
| 2019 | 86,415 | 6.2% | 93.8% |
| 2018 | 85,153 | 6.2% | 93.8% |
| 2017 | 83,784 | 6.1% | 93.9% |
| 2016 | 82,321 | 6.0% | 94.0% |
| 2015 | 81,340 | 5.5% | 94.5% |
| 2014 | 80,377 | 5.8% | 94.2% |
| 2013 | 79,453 | 5.5% | 94.5% |
| 2012 | 78,397 | 5.3% | 94.7% |
| 2011 | 77,277 | 5.0% | 95.0% |
| 2010 | 75,835 | 5.3% | 94.7% |
Nativity & Citizenship FAQs for Frederick County, Virginia
Approximately 7.8% of residents in Frederick County, Virginia were born outside the United States.
The vast majority of residents, roughly 95.9%, are U.S. citizens (including both native-born and naturalized citizens).