James City County, Virginia Nativity & Citizenship Status (2024)
Place of birth and citizenship status analysis for James City County, Virginia
James City County, Virginia Nativity & Citizenship Indicators (2024)
Native Born
92.4%
Foreign Born
7.6%
Naturalized
4.6%
US Citizens
97.0%
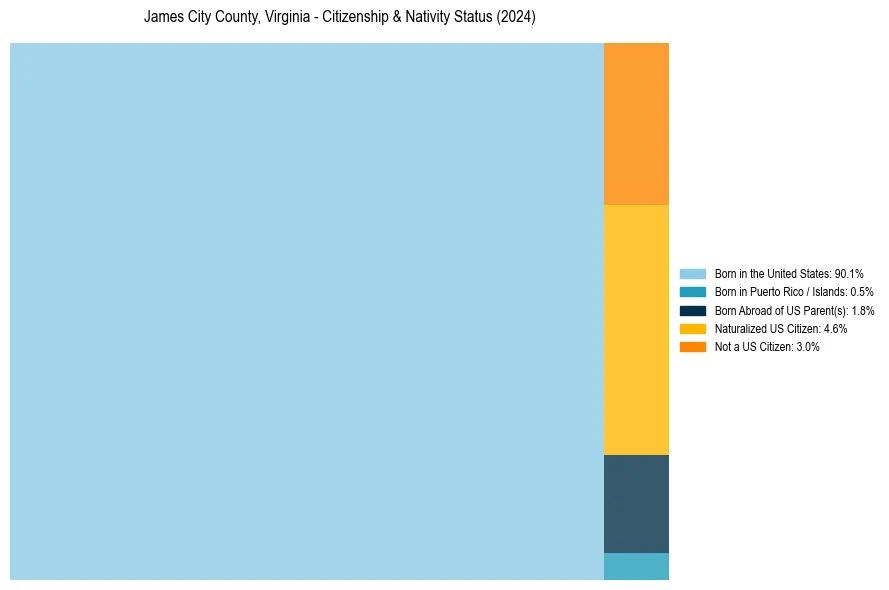
James City County, Virginia Nativity & Citizenship Distribution
James City County, Virginia Historical Nativity Trends (2010–2024)
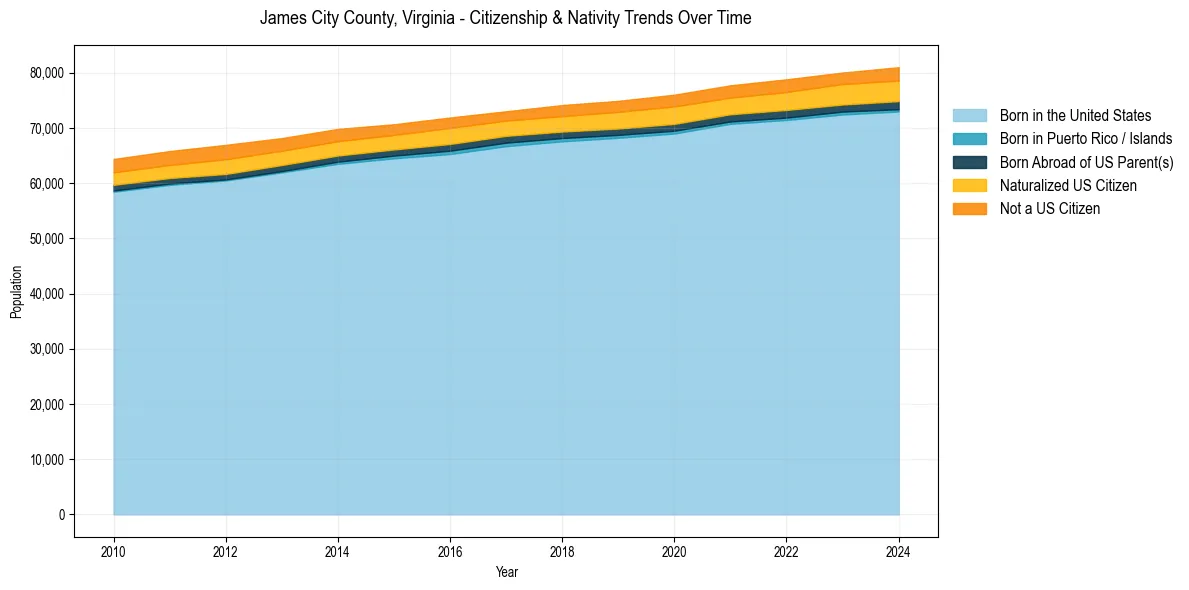
James City County, Virginia Population & Nativity History
| Year | Total Pop | Foreign Born | Native Born |
|---|---|---|---|
| 2024 | 81,013 | 7.6% | 92.4% |
| 2023 | 80,046 | 7.2% | 92.8% |
| 2022 | 78,818 | 7.0% | 93.0% |
| 2021 | 77,733 | 6.7% | 93.3% |
| 2020 | 76,032 | 7.0% | 93.0% |
| 2019 | 74,916 | 6.7% | 93.3% |
| 2018 | 74,153 | 6.5% | 93.5% |
| 2017 | 73,028 | 6.1% | 93.9% |
| 2016 | 71,900 | 6.7% | 93.3% |
| 2015 | 70,673 | 6.5% | 93.5% |
| 2014 | 69,832 | 6.9% | 93.1% |
| 2013 | 68,171 | 7.2% | 92.8% |
| 2012 | 66,939 | 7.9% | 92.1% |
| 2011 | 65,818 | 7.4% | 92.6% |
| 2010 | 64,386 | 7.3% | 92.7% |
Nativity & Citizenship FAQs for James City County, Virginia
Approximately 7.6% of residents in James City County, Virginia were born outside the United States.
The vast majority of residents, roughly 97.0%, are U.S. citizens (including both native-born and naturalized citizens).