Lynchburg city, Virginia Nativity & Citizenship Status (2024)
Place of birth and citizenship status analysis for Lynchburg city, Virginia
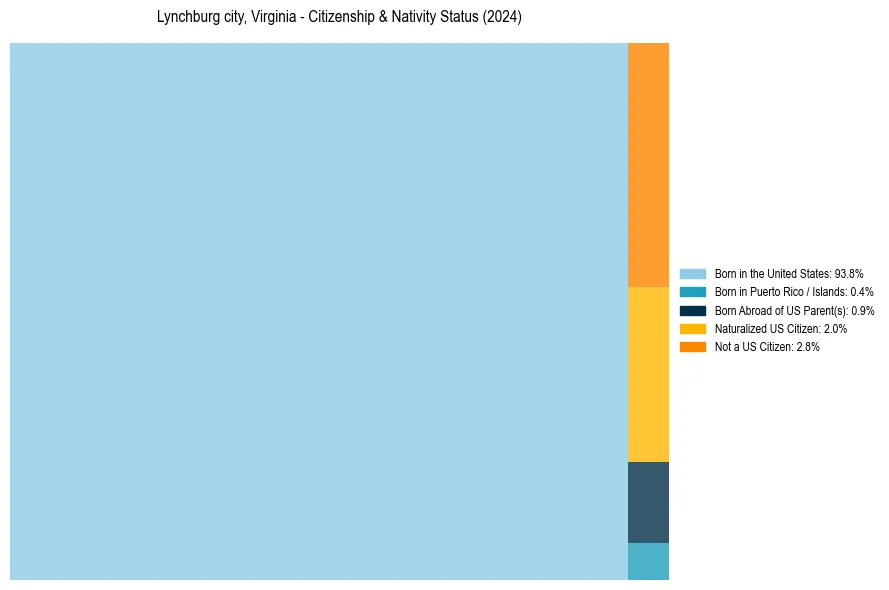
Lynchburg city, Virginia Nativity & Citizenship Indicators (2024)
Native Born
95.2%
Foreign Born
4.8%
Naturalized
2.0%
US Citizens
97.2%
Lynchburg city, Virginia Nativity & Citizenship Distribution
Lynchburg city, Virginia Historical Nativity Trends (2010–2024)
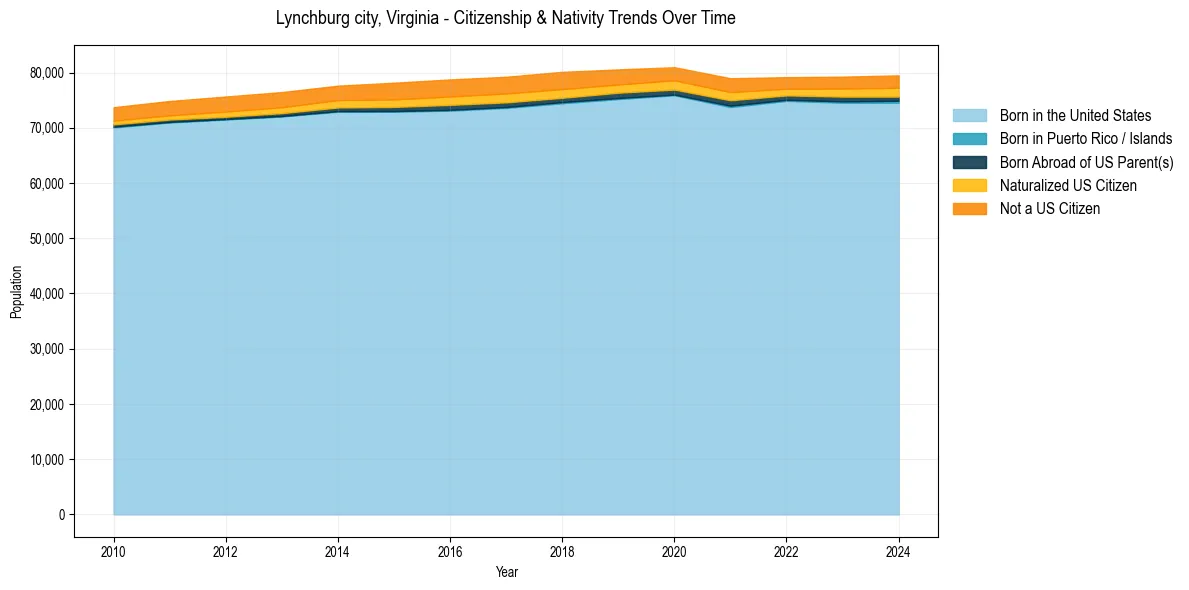
Lynchburg city, Virginia Population & Nativity History
| Year | Total Pop | Foreign Born | Native Born |
|---|---|---|---|
| 2024 | 79,497 | 4.8% | 95.2% |
| 2023 | 79,255 | 4.6% | 95.4% |
| 2022 | 79,166 | 4.2% | 95.8% |
| 2021 | 78,973 | 5.1% | 94.9% |
| 2020 | 80,970 | 5.0% | 95.0% |
| 2019 | 80,569 | 5.2% | 94.8% |
| 2018 | 80,131 | 5.9% | 94.1% |
| 2017 | 79,237 | 5.8% | 94.2% |
| 2016 | 78,755 | 5.9% | 94.1% |
| 2015 | 78,158 | 5.6% | 94.4% |
| 2014 | 77,626 | 5.1% | 94.9% |
| 2013 | 76,467 | 5.0% | 95.0% |
| 2012 | 75,657 | 4.8% | 95.2% |
| 2011 | 74,849 | 4.5% | 95.5% |
| 2010 | 73,726 | 4.2% | 95.8% |
Nativity & Citizenship FAQs for Lynchburg city, Virginia
Approximately 4.8% of residents in Lynchburg city, Virginia were born outside the United States.
The vast majority of residents, roughly 97.2%, are U.S. citizens (including both native-born and naturalized citizens).