Montgomery County, Virginia Nativity & Citizenship Status (2024)
Place of birth and citizenship status analysis for Montgomery County, Virginia
Montgomery County, Virginia Nativity & Citizenship Indicators (2024)
Native Born
90.5%
Foreign Born
9.5%
Naturalized
3.2%
US Citizens
93.7%
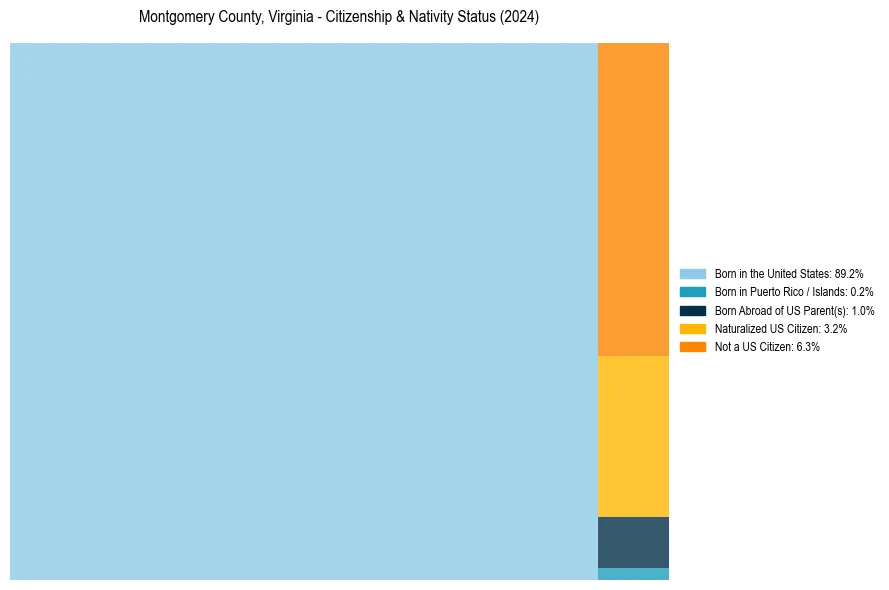
Montgomery County, Virginia Nativity & Citizenship Distribution
Montgomery County, Virginia Historical Nativity Trends (2010–2024)
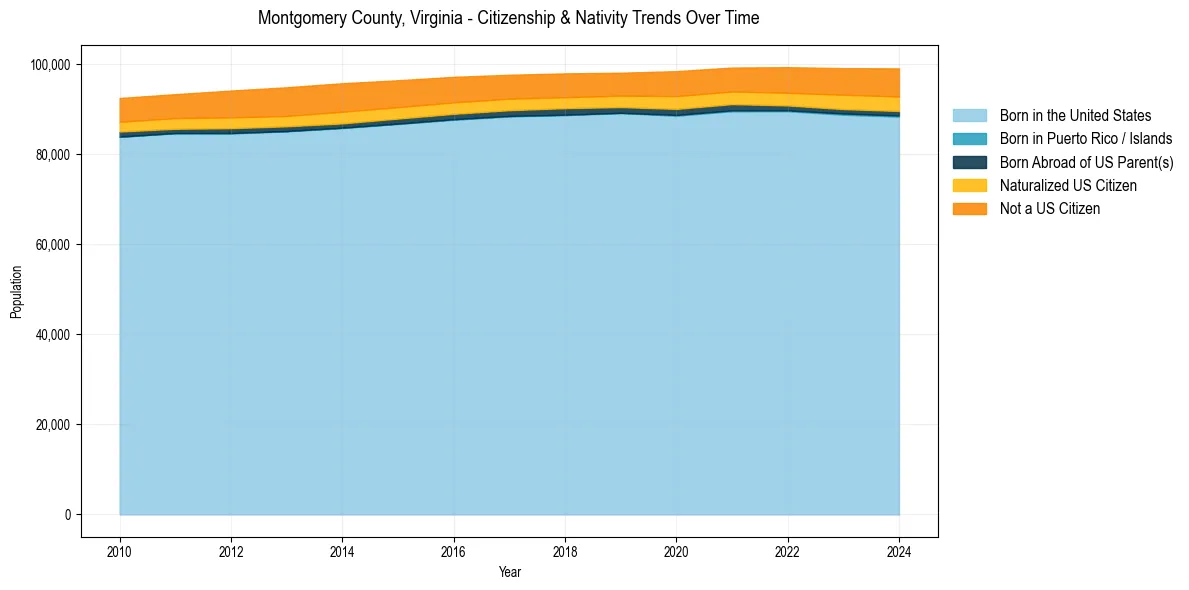
Montgomery County, Virginia Population & Nativity History
| Year | Total Pop | Foreign Born | Native Born |
|---|---|---|---|
| 2024 | 99,101 | 9.5% | 90.5% |
| 2023 | 99,159 | 9.2% | 90.8% |
| 2022 | 99,373 | 8.6% | 91.4% |
| 2021 | 99,294 | 8.2% | 91.8% |
| 2020 | 98,495 | 8.5% | 91.5% |
| 2019 | 98,140 | 7.8% | 92.2% |
| 2018 | 97,997 | 7.9% | 92.1% |
| 2017 | 97,692 | 8.1% | 91.9% |
| 2016 | 97,227 | 8.5% | 91.5% |
| 2015 | 96,467 | 8.8% | 91.2% |
| 2014 | 95,808 | 9.3% | 90.7% |
| 2013 | 94,910 | 9.1% | 90.9% |
| 2012 | 94,179 | 8.9% | 91.1% |
| 2011 | 93,379 | 8.2% | 91.8% |
| 2010 | 92,527 | 8.1% | 91.9% |
Nativity & Citizenship FAQs for Montgomery County, Virginia
Approximately 9.5% of residents in Montgomery County, Virginia were born outside the United States.
The vast majority of residents, roughly 93.7%, are U.S. citizens (including both native-born and naturalized citizens).