Powhatan County, Virginia Nativity & Citizenship Status (2024)
Place of birth and citizenship status analysis for Powhatan County, Virginia
Powhatan County, Virginia Nativity & Citizenship Indicators (2024)
Native Born
96.8%
Foreign Born
3.2%
Naturalized
2.0%
US Citizens
98.8%
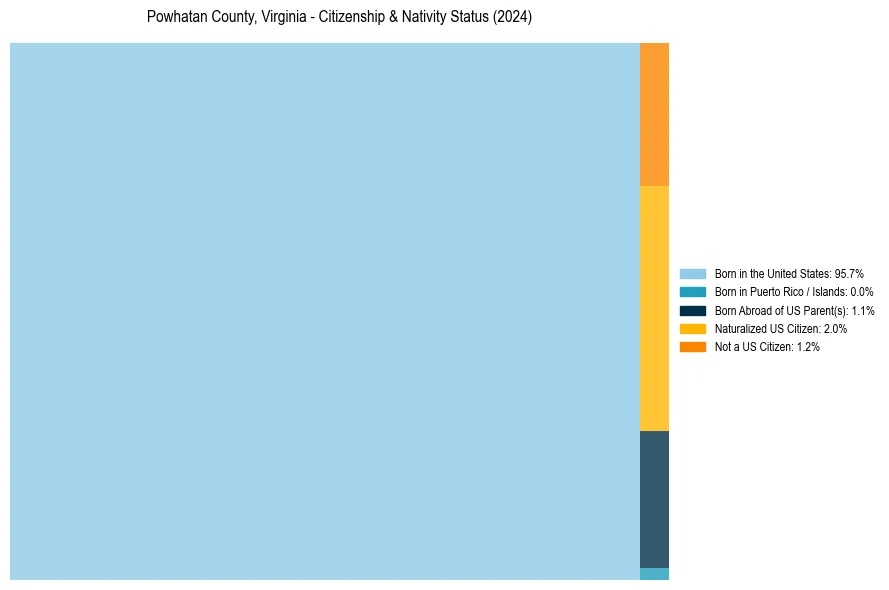
Powhatan County, Virginia Nativity & Citizenship Distribution
Powhatan County, Virginia Historical Nativity Trends (2010–2024)
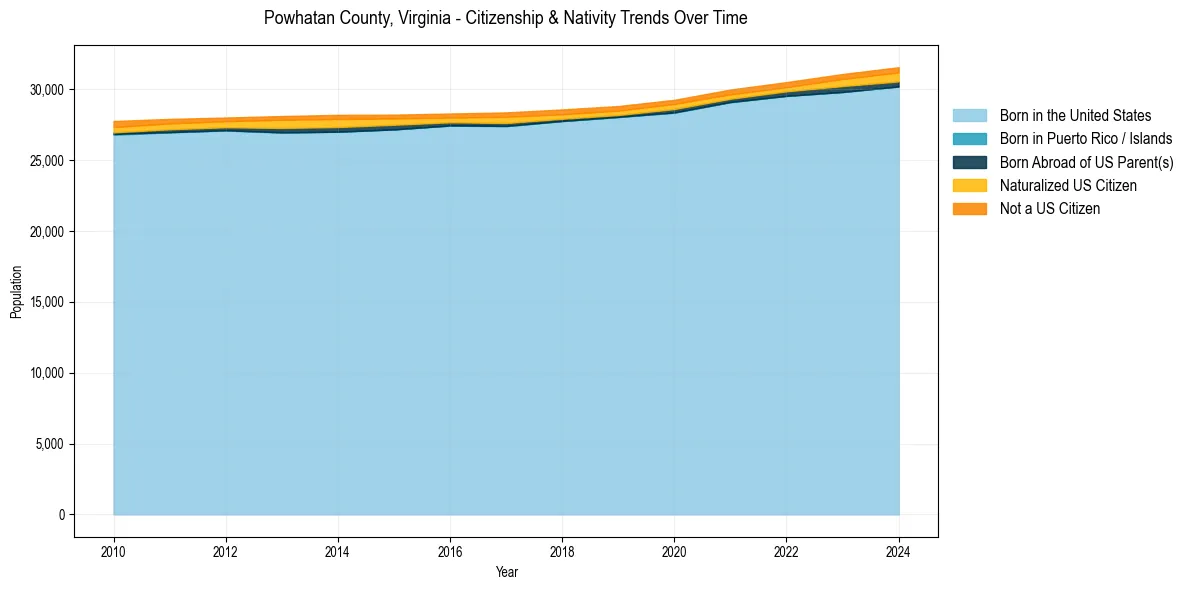
Powhatan County, Virginia Population & Nativity History
| Year | Total Pop | Foreign Born | Native Born |
|---|---|---|---|
| 2024 | 31,555 | 3.2% | 96.8% |
| 2023 | 31,074 | 2.7% | 97.3% |
| 2022 | 30,503 | 2.1% | 97.9% |
| 2021 | 29,979 | 2.2% | 97.8% |
| 2020 | 29,253 | 2.2% | 97.8% |
| 2019 | 28,815 | 2.2% | 97.8% |
| 2018 | 28,574 | 2.3% | 97.7% |
| 2017 | 28,364 | 2.6% | 97.4% |
| 2016 | 28,286 | 2.2% | 97.8% |
| 2015 | 28,207 | 2.5% | 97.5% |
| 2014 | 28,193 | 3.1% | 96.9% |
| 2013 | 28,108 | 3.0% | 97.0% |
| 2012 | 28,003 | 2.5% | 97.5% |
| 2011 | 27,907 | 2.6% | 97.4% |
| 2010 | 27,758 | 2.9% | 97.1% |
Nativity & Citizenship FAQs for Powhatan County, Virginia
Approximately 3.2% of residents in Powhatan County, Virginia were born outside the United States.
The vast majority of residents, roughly 98.8%, are U.S. citizens (including both native-born and naturalized citizens).