Stafford County, Virginia Nativity & Citizenship Status (2024)
Place of birth and citizenship status analysis for Stafford County, Virginia
Stafford County, Virginia Nativity & Citizenship Indicators (2024)
Native Born
86.2%
Foreign Born
13.8%
Naturalized
8.2%
US Citizens
94.4%
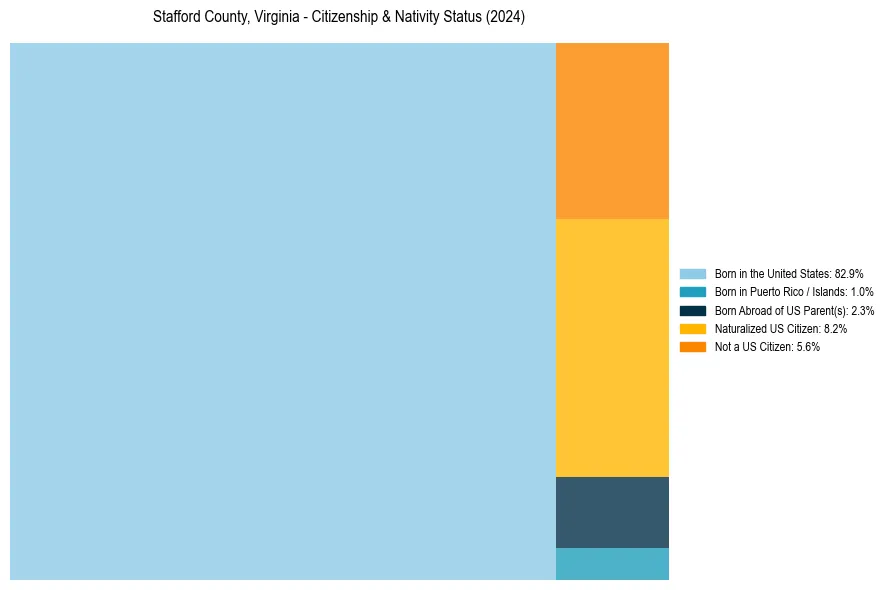
Stafford County, Virginia Nativity & Citizenship Distribution
Stafford County, Virginia Historical Nativity Trends (2010–2024)
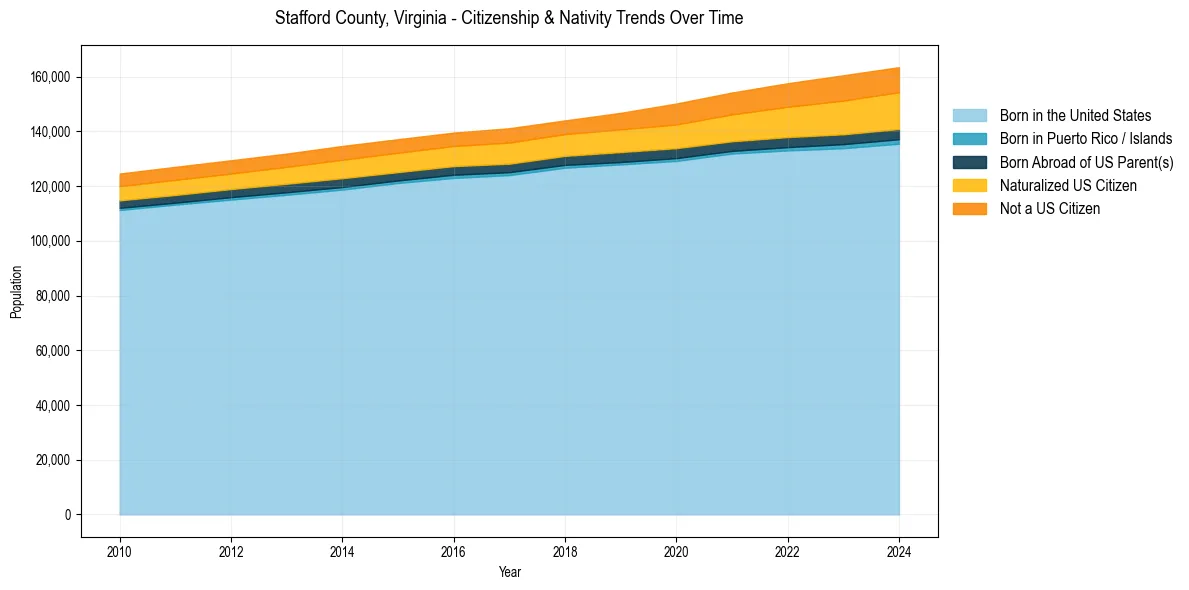
Stafford County, Virginia Population & Nativity History
| Year | Total Pop | Foreign Born | Native Born |
|---|---|---|---|
| 2024 | 163,466 | 13.8% | 86.2% |
| 2023 | 160,520 | 13.4% | 86.6% |
| 2022 | 157,606 | 12.5% | 87.5% |
| 2021 | 154,204 | 11.6% | 88.4% |
| 2020 | 150,185 | 10.9% | 89.1% |
| 2019 | 146,773 | 9.8% | 90.2% |
| 2018 | 144,012 | 9.0% | 91.0% |
| 2017 | 141,159 | 9.2% | 90.8% |
| 2016 | 139,548 | 8.8% | 91.2% |
| 2015 | 137,145 | 8.8% | 91.2% |
| 2014 | 134,672 | 8.8% | 91.2% |
| 2013 | 131,885 | 8.4% | 91.6% |
| 2012 | 129,446 | 8.1% | 91.9% |
| 2011 | 127,041 | 8.1% | 91.9% |
| 2010 | 124,587 | 7.9% | 92.1% |
Nativity & Citizenship FAQs for Stafford County, Virginia
Approximately 13.8% of residents in Stafford County, Virginia were born outside the United States.
The vast majority of residents, roughly 94.4%, are U.S. citizens (including both native-born and naturalized citizens).