Williamsburg city, Virginia Nativity & Citizenship Status (2024)
Place of birth and citizenship status analysis for Williamsburg city, Virginia
Williamsburg city, Virginia Nativity & Citizenship Indicators (2024)
Native Born
89.8%
Foreign Born
10.2%
Naturalized
4.9%
US Citizens
94.7%
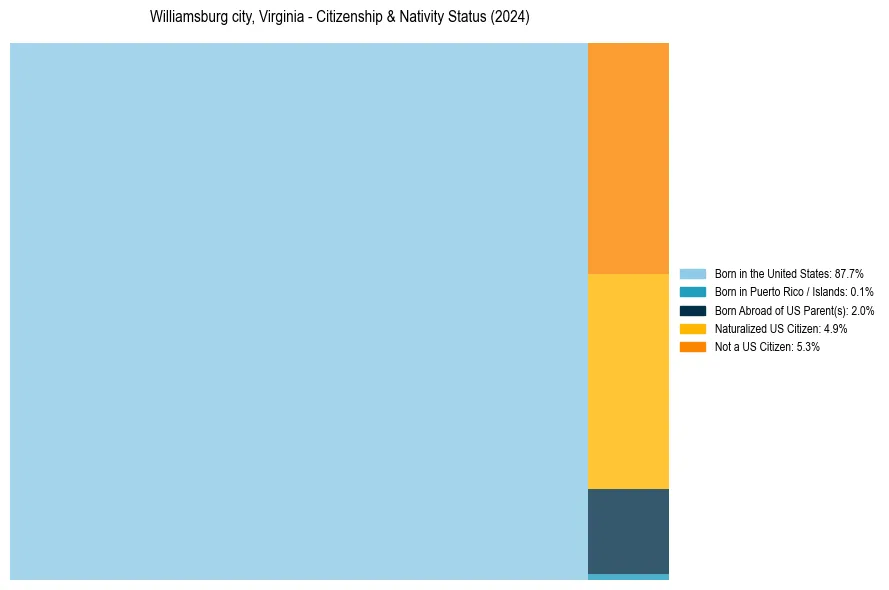
Williamsburg city, Virginia Nativity & Citizenship Distribution
Williamsburg city, Virginia Historical Nativity Trends (2010–2024)
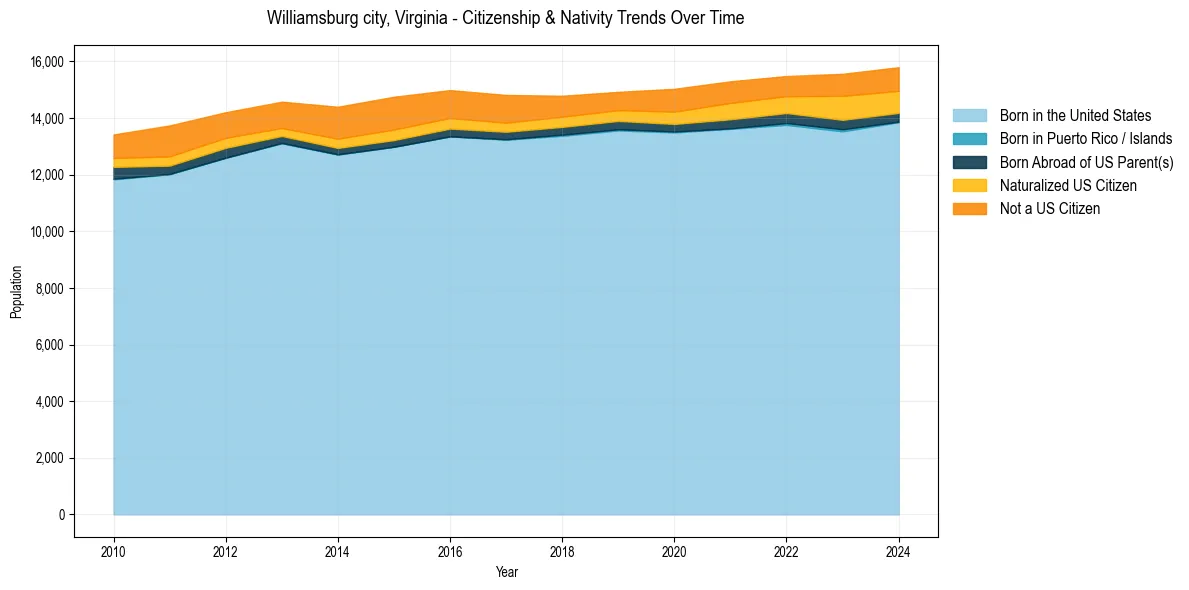
Williamsburg city, Virginia Population & Nativity History
| Year | Total Pop | Foreign Born | Native Born |
|---|---|---|---|
| 2024 | 15,798 | 10.2% | 89.8% |
| 2023 | 15,564 | 10.4% | 89.6% |
| 2022 | 15,486 | 8.4% | 91.6% |
| 2021 | 15,299 | 8.8% | 91.2% |
| 2020 | 15,034 | 8.3% | 91.7% |
| 2019 | 14,927 | 6.9% | 93.1% |
| 2018 | 14,788 | 7.4% | 92.6% |
| 2017 | 14,817 | 8.8% | 91.2% |
| 2016 | 14,988 | 9.1% | 90.9% |
| 2015 | 14,754 | 10.4% | 89.6% |
| 2014 | 14,401 | 10.1% | 89.9% |
| 2013 | 14,579 | 8.3% | 91.7% |
| 2012 | 14,207 | 8.9% | 91.1% |
| 2011 | 13,741 | 10.3% | 89.7% |
| 2010 | 13,421 | 8.5% | 91.5% |
Nativity & Citizenship FAQs for Williamsburg city, Virginia
Approximately 10.2% of residents in Williamsburg city, Virginia were born outside the United States.
The vast majority of residents, roughly 94.7%, are U.S. citizens (including both native-born and naturalized citizens).