Adams County, Washington Nativity & Citizenship Status (2024)
Place of birth and citizenship status analysis for Adams County, Washington
Adams County, Washington Nativity & Citizenship Indicators (2024)
Native Born
75.5%
Foreign Born
24.5%
Naturalized
4.8%
US Citizens
80.3%
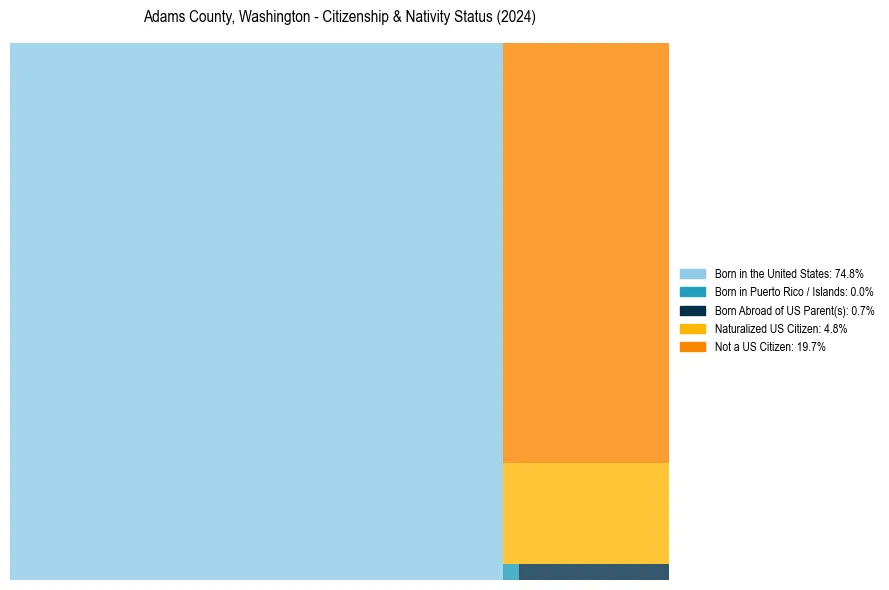
Adams County, Washington Nativity & Citizenship Distribution
Adams County, Washington Historical Nativity Trends (2010–2024)
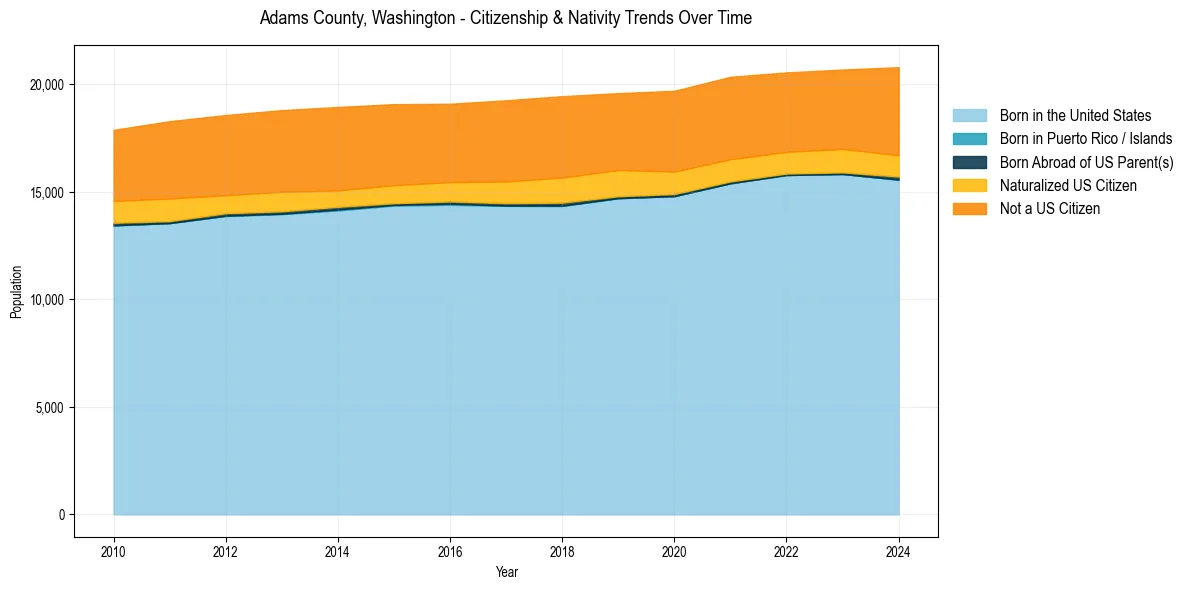
Adams County, Washington Population & Nativity History
| Year | Total Pop | Foreign Born | Native Born |
|---|---|---|---|
| 2024 | 20,800 | 24.5% | 75.5% |
| 2023 | 20,690 | 23.1% | 76.9% |
| 2022 | 20,557 | 22.9% | 77.1% |
| 2021 | 20,353 | 23.9% | 76.1% |
| 2020 | 19,702 | 24.4% | 75.6% |
| 2019 | 19,594 | 24.5% | 75.5% |
| 2018 | 19,452 | 25.5% | 74.5% |
| 2017 | 19,261 | 24.9% | 75.1% |
| 2016 | 19,100 | 23.8% | 76.2% |
| 2015 | 19,081 | 24.2% | 75.8% |
| 2014 | 18,951 | 24.5% | 75.5% |
| 2013 | 18,802 | 25.0% | 75.0% |
| 2012 | 18,575 | 24.6% | 75.4% |
| 2011 | 18,289 | 25.4% | 74.6% |
| 2010 | 17,884 | 24.2% | 75.8% |
Nativity & Citizenship FAQs for Adams County, Washington
Approximately 24.5% of residents in Adams County, Washington were born outside the United States.
The vast majority of residents, roughly 80.3%, are U.S. citizens (including both native-born and naturalized citizens).