Washington Age & Gender Distribution (2024)
Population distribution by age and gender for Washington
Washington Age & Gender Statistics (2024)
Total Population
7,816,116
Median Age
38.3
Male Median
37.5
Female Median
39.2
Washington Population Growth
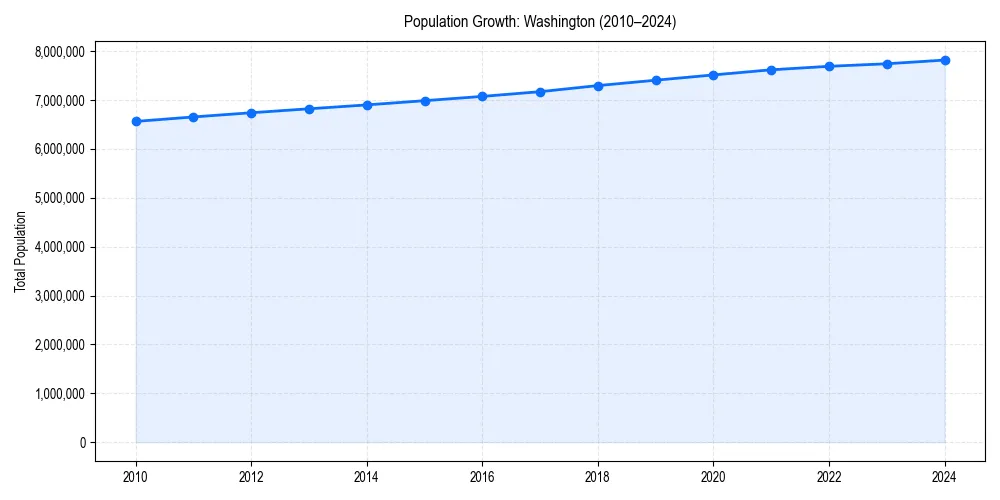
Washington Demographic Trend
Since 2010, the population of has changed by +19.1%%.
+19.1%% Growth
Washington Age & Gender Pyramid
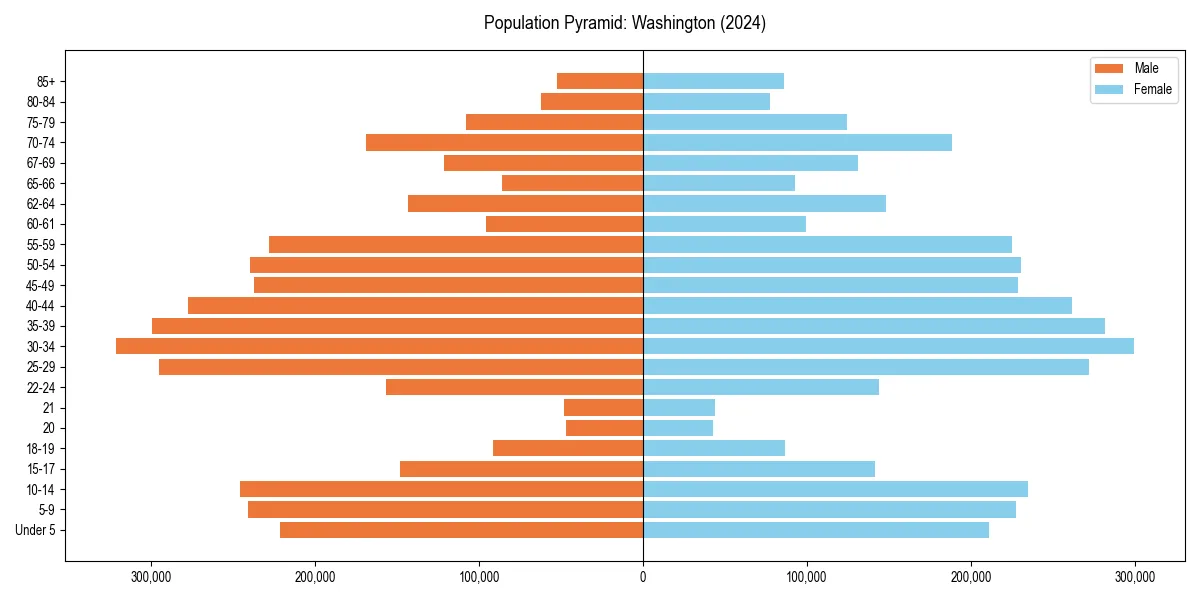
Figure 2: Population distribution by age and gender for 2024.
Washington Historical Population Data
| Year | Median Age | Population |
|---|---|---|
| 2024 | 38.3 | 7,816,116 |
| 2023 | 38.2 | 7,740,984 |
| 2022 | 38.0 | 7,688,549 |
| 2021 | 37.9 | 7,617,364 |
| 2020 | 37.8 | 7,512,465 |
| 2019 | 37.7 | 7,404,107 |
| 2018 | 37.6 | 7,294,336 |
| 2017 | 37.6 | 7,169,967 |
| 2016 | 37.6 | 7,073,146 |
| 2015 | 37.4 | 6,985,464 |
| 2014 | 37.4 | 6,899,123 |
| 2013 | 37.3 | 6,819,579 |
| 2012 | 37.2 | 6,738,714 |
| 2011 | 37.1 | 6,652,845 |
| 2010 | 37.0 | 6,561,297 |
Washington Age Group Breakdown (2024)
| Age Cohort | Percentage |
|---|---|
| Under 5 | 5.5% |
| 5–17 | 15.8% |
| 18–24 | 8.5% |
| 25–34 | 15.2% |
| 35–54 | 26.3% |
| 55–64 | 12.0% |
| 65+ | 16.6% |
Dependency Ratios for Washington
- Total Dependency Ratio:
- 61.3
- Youth Dependency:
- 34.5
- Old-Age Dependency:
- 26.8
The dependency ratio measures dependents (ages 0-17 and 65+) per 100 working-age individuals (ages 18-64).
Age & Gender FAQs for Washington
The median age in Washington is 38.3 years.
According to latest Census data, the total population of Washington is 7,816,116.
In Washington, seniors (ages 65+) make up 16.6% of the population, while children under 18 represent 15.8%.
Based on historical data since 2010, the population in Washington has remained stable.