Benton County, Washington Nativity & Citizenship Status (2024)
Place of birth and citizenship status analysis for Benton County, Washington
Benton County, Washington Nativity & Citizenship Indicators (2024)
Native Born
88.6%
Foreign Born
11.4%
Naturalized
5.0%
US Citizens
93.5%
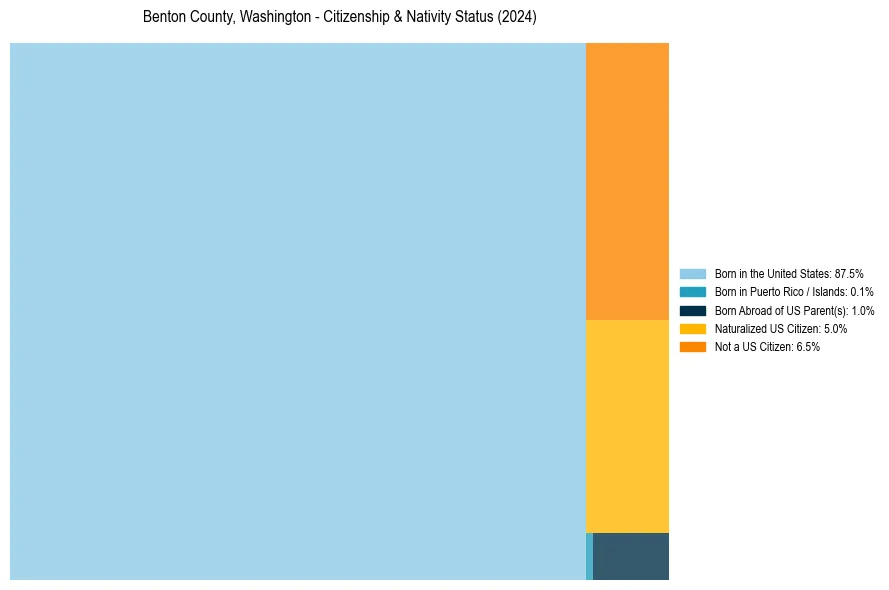
Benton County, Washington Nativity & Citizenship Distribution
Benton County, Washington Historical Nativity Trends (2010–2024)
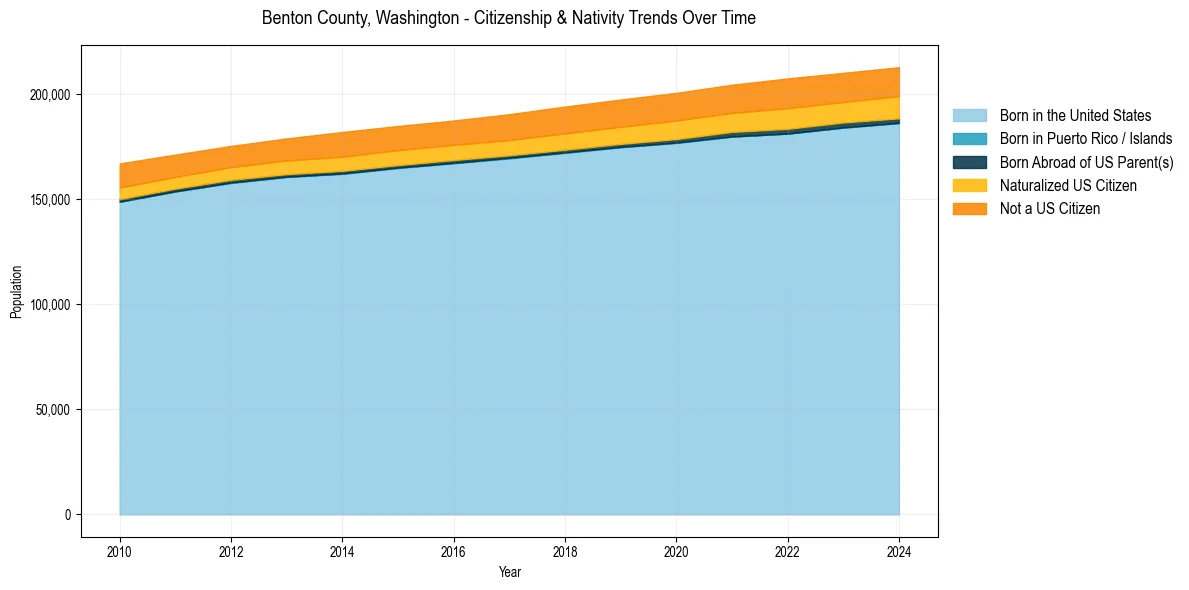
Benton County, Washington Population & Nativity History
| Year | Total Pop | Foreign Born | Native Born |
|---|---|---|---|
| 2024 | 212,905 | 11.4% | 88.6% |
| 2023 | 210,224 | 11.2% | 88.8% |
| 2022 | 207,560 | 11.6% | 88.4% |
| 2021 | 204,551 | 11.0% | 89.0% |
| 2020 | 200,715 | 11.0% | 89.0% |
| 2019 | 197,518 | 10.7% | 89.3% |
| 2018 | 194,168 | 10.6% | 89.4% |
| 2017 | 190,529 | 10.3% | 89.7% |
| 2016 | 187,519 | 10.0% | 90.0% |
| 2015 | 184,930 | 10.1% | 89.9% |
| 2014 | 182,053 | 10.2% | 89.8% |
| 2013 | 178,992 | 9.5% | 90.5% |
| 2012 | 175,424 | 9.2% | 90.8% |
| 2011 | 171,303 | 9.5% | 90.5% |
| 2010 | 167,077 | 10.2% | 89.8% |
Nativity & Citizenship FAQs for Benton County, Washington
Approximately 11.4% of residents in Benton County, Washington were born outside the United States.
The vast majority of residents, roughly 93.5%, are U.S. citizens (including both native-born and naturalized citizens).