Clark County, Washington Nativity & Citizenship Status (2024)
Place of birth and citizenship status analysis for Clark County, Washington
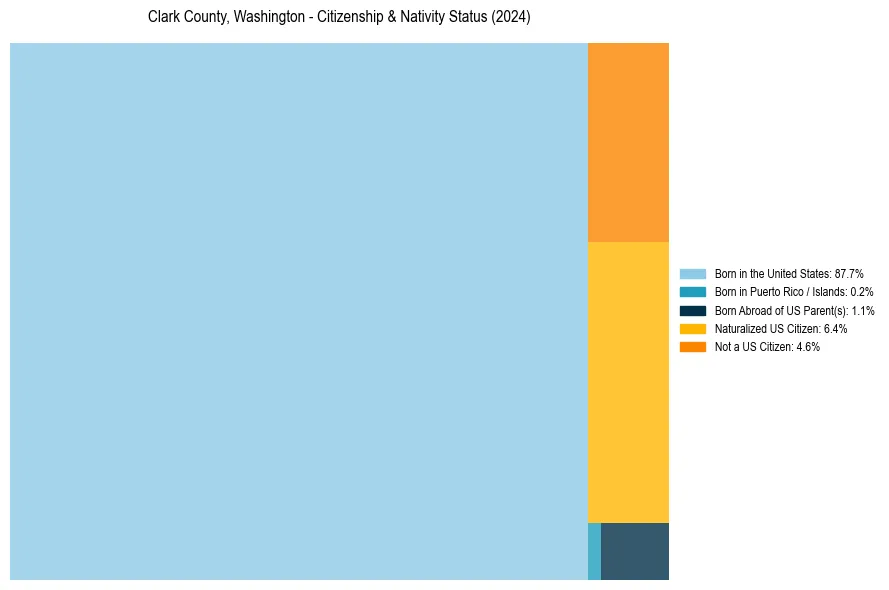
Clark County, Washington Nativity & Citizenship Indicators (2024)
Native Born
89.0%
Foreign Born
11.0%
Naturalized
6.4%
US Citizens
95.4%
Clark County, Washington Nativity & Citizenship Distribution
Clark County, Washington Historical Nativity Trends (2010–2024)
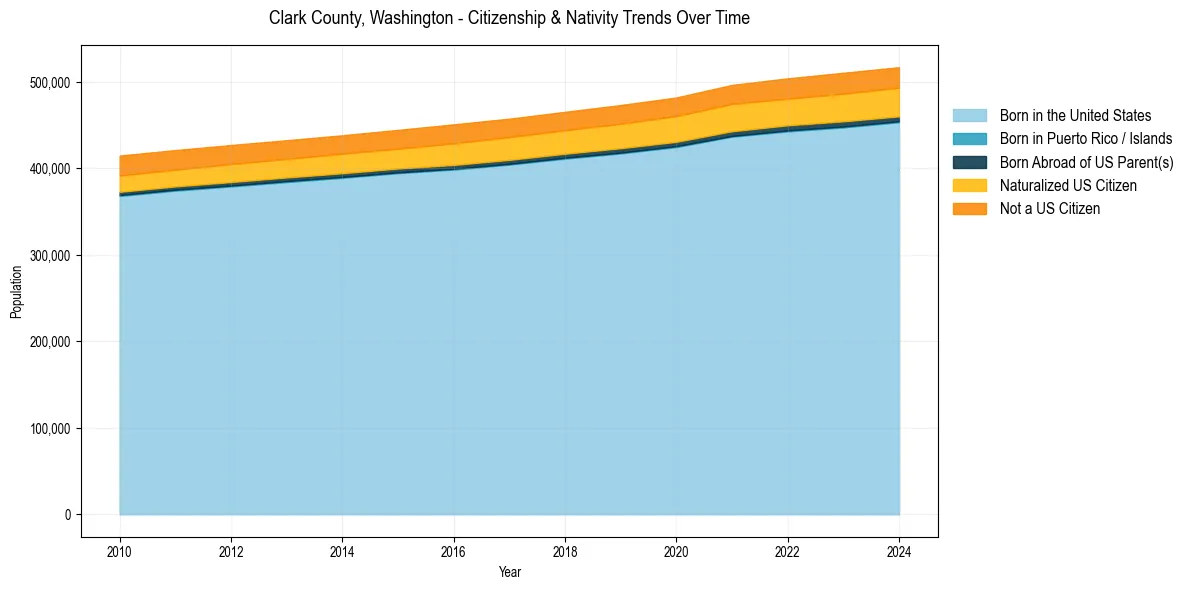
Clark County, Washington Population & Nativity History
| Year | Total Pop | Foreign Born | Native Born |
|---|---|---|---|
| 2024 | 516,959 | 11.0% | 89.0% |
| 2023 | 510,516 | 11.0% | 89.0% |
| 2022 | 504,091 | 10.8% | 89.2% |
| 2021 | 496,494 | 10.8% | 89.2% |
| 2020 | 481,950 | 10.6% | 89.4% |
| 2019 | 473,252 | 10.6% | 89.4% |
| 2018 | 465,384 | 10.4% | 89.6% |
| 2017 | 457,474 | 10.4% | 89.6% |
| 2016 | 450,893 | 10.4% | 89.6% |
| 2015 | 444,506 | 10.1% | 89.9% |
| 2014 | 438,272 | 10.0% | 90.0% |
| 2013 | 432,549 | 10.0% | 90.0% |
| 2012 | 426,984 | 10.0% | 90.0% |
| 2011 | 421,154 | 10.0% | 90.0% |
| 2010 | 414,816 | 10.1% | 89.9% |
Nativity & Citizenship FAQs for Clark County, Washington
Approximately 11.0% of residents in Clark County, Washington were born outside the United States.
The vast majority of residents, roughly 95.4%, are U.S. citizens (including both native-born and naturalized citizens).