Franklin County, Washington Nativity & Citizenship Status (2024)
Place of birth and citizenship status analysis for Franklin County, Washington
Franklin County, Washington Nativity & Citizenship Indicators (2024)
Native Born
79.2%
Foreign Born
20.8%
Naturalized
7.2%
US Citizens
86.4%
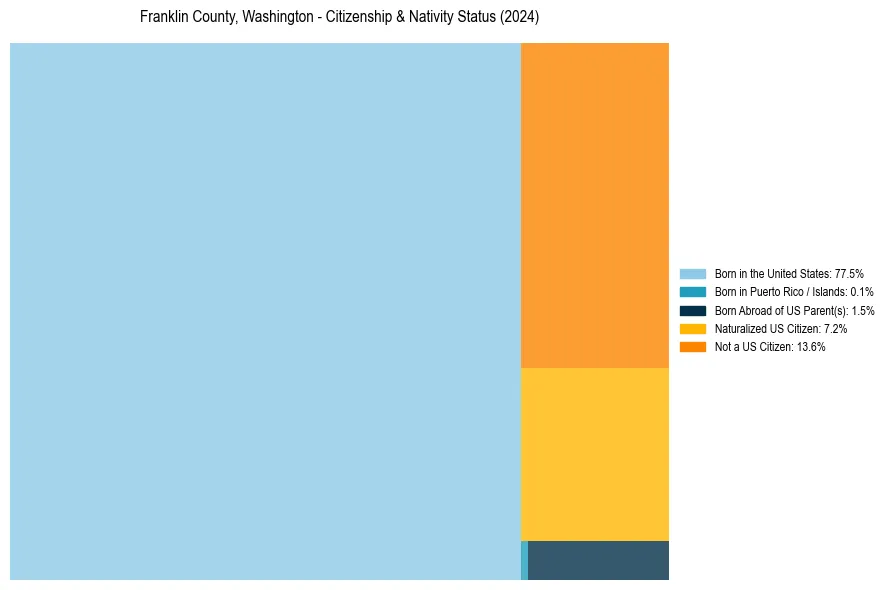
Franklin County, Washington Nativity & Citizenship Distribution
Franklin County, Washington Historical Nativity Trends (2010–2024)
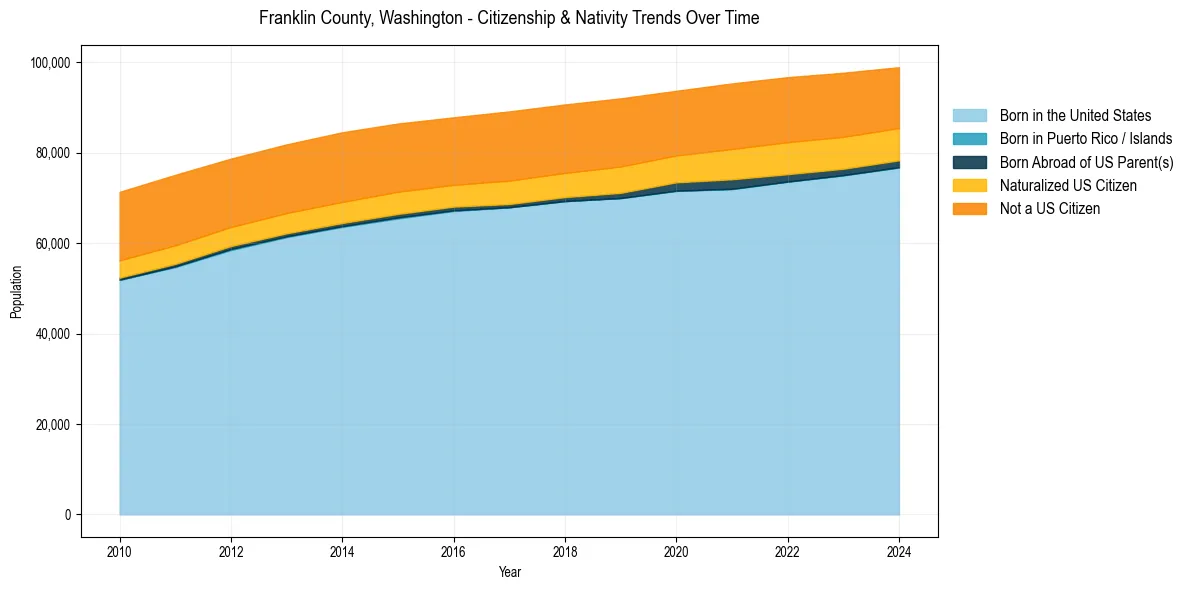
Franklin County, Washington Population & Nativity History
| Year | Total Pop | Foreign Born | Native Born |
|---|---|---|---|
| 2024 | 98,902 | 20.8% | 79.2% |
| 2023 | 97,676 | 21.7% | 78.3% |
| 2022 | 96,692 | 22.2% | 77.8% |
| 2021 | 95,313 | 22.2% | 77.8% |
| 2020 | 93,681 | 21.6% | 78.4% |
| 2019 | 92,009 | 22.7% | 77.3% |
| 2018 | 90,660 | 22.6% | 77.4% |
| 2017 | 89,124 | 23.0% | 77.0% |
| 2016 | 87,810 | 22.5% | 77.5% |
| 2015 | 86,443 | 23.1% | 76.9% |
| 2014 | 84,508 | 23.7% | 76.3% |
| 2013 | 81,835 | 24.0% | 76.0% |
| 2012 | 78,680 | 24.6% | 75.4% |
| 2011 | 75,102 | 26.2% | 73.8% |
| 2010 | 71,329 | 26.6% | 73.4% |
Nativity & Citizenship FAQs for Franklin County, Washington
Approximately 20.8% of residents in Franklin County, Washington were born outside the United States.
The vast majority of residents, roughly 86.4%, are U.S. citizens (including both native-born and naturalized citizens).