Grant County, Washington Nativity & Citizenship Status (2024)
Place of birth and citizenship status analysis for Grant County, Washington
Grant County, Washington Nativity & Citizenship Indicators (2024)
Native Born
83.9%
Foreign Born
16.1%
Naturalized
3.8%
US Citizens
87.7%
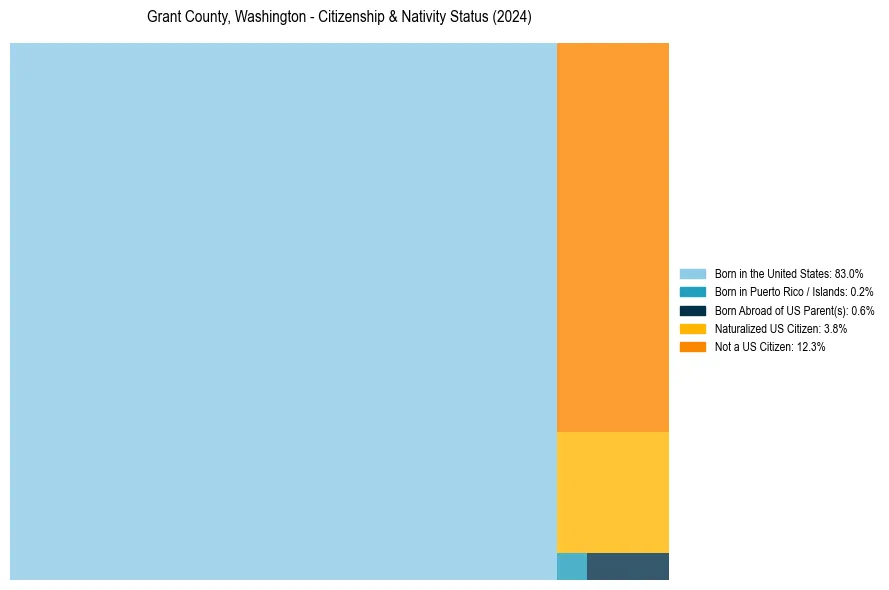
Grant County, Washington Nativity & Citizenship Distribution
Grant County, Washington Historical Nativity Trends (2010–2024)
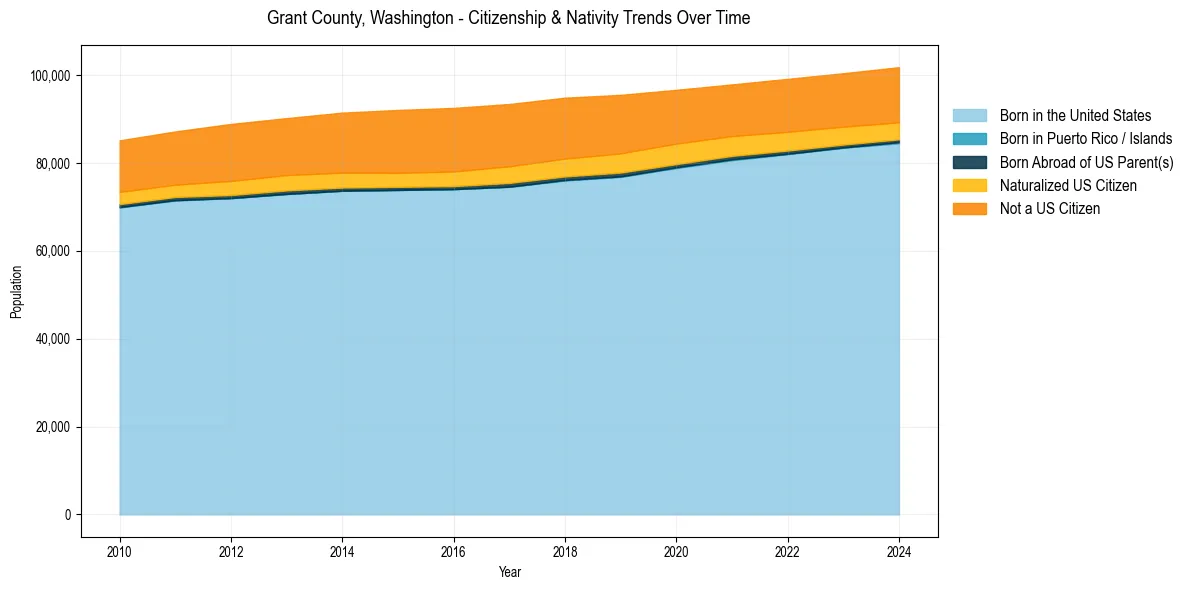
Grant County, Washington Population & Nativity History
| Year | Total Pop | Foreign Born | Native Born |
|---|---|---|---|
| 2024 | 101,799 | 16.1% | 83.9% |
| 2023 | 100,428 | 16.2% | 83.8% |
| 2022 | 99,145 | 16.5% | 83.5% |
| 2021 | 97,874 | 16.6% | 83.4% |
| 2020 | 96,648 | 17.5% | 82.5% |
| 2019 | 95,502 | 18.5% | 81.5% |
| 2018 | 94,860 | 18.9% | 81.1% |
| 2017 | 93,420 | 19.2% | 80.8% |
| 2016 | 92,530 | 19.3% | 80.7% |
| 2015 | 92,070 | 19.0% | 81.0% |
| 2014 | 91,458 | 18.7% | 81.3% |
| 2013 | 90,202 | 18.2% | 81.8% |
| 2012 | 88,885 | 18.2% | 81.8% |
| 2011 | 87,179 | 17.1% | 82.9% |
| 2010 | 85,142 | 17.0% | 83.0% |
Nativity & Citizenship FAQs for Grant County, Washington
Approximately 16.1% of residents in Grant County, Washington were born outside the United States.
The vast majority of residents, roughly 87.7%, are U.S. citizens (including both native-born and naturalized citizens).