Grays Harbor County, Washington Nativity & Citizenship Status (2024)
Place of birth and citizenship status analysis for Grays Harbor County, Washington
Grays Harbor County, Washington Nativity & Citizenship Indicators (2024)
Native Born
94.4%
Foreign Born
5.6%
Naturalized
2.2%
US Citizens
96.6%
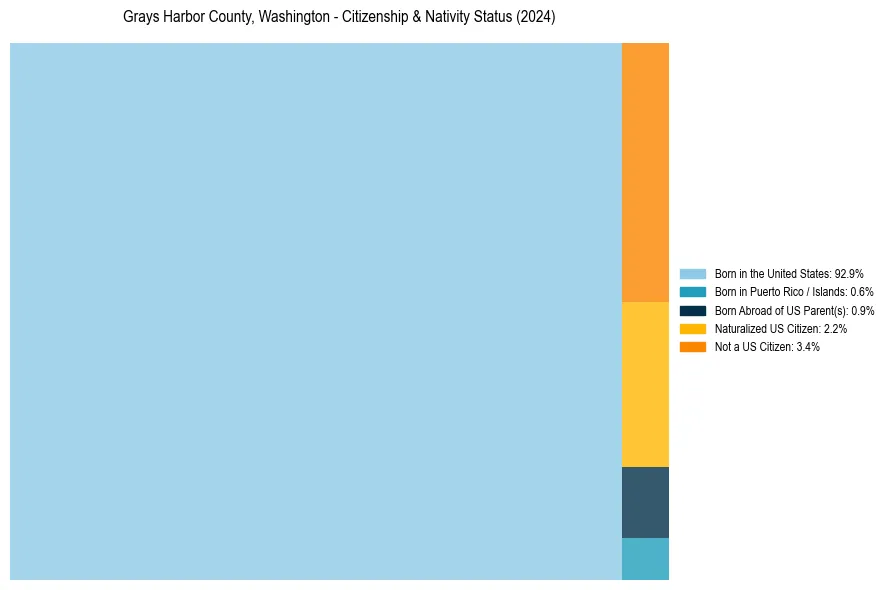
Grays Harbor County, Washington Nativity & Citizenship Distribution
Grays Harbor County, Washington Historical Nativity Trends (2010–2024)
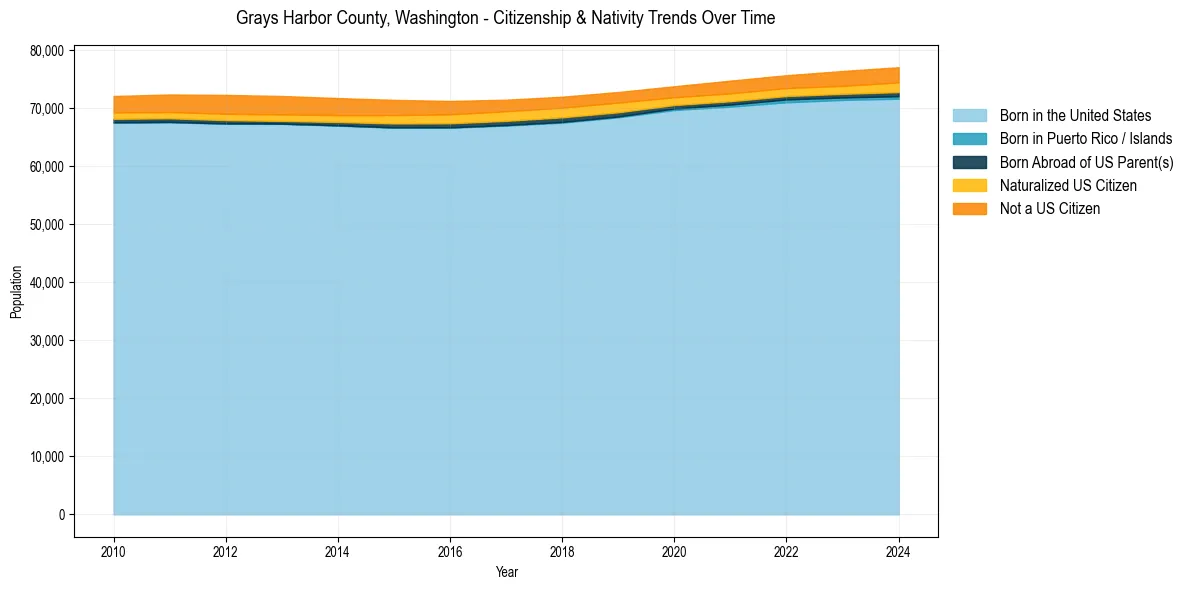
Grays Harbor County, Washington Population & Nativity History
| Year | Total Pop | Foreign Born | Native Born |
|---|---|---|---|
| 2024 | 77,053 | 5.6% | 94.4% |
| 2023 | 76,397 | 5.2% | 94.8% |
| 2022 | 75,672 | 4.7% | 95.3% |
| 2021 | 74,737 | 4.8% | 95.2% |
| 2020 | 73,769 | 4.4% | 95.6% |
| 2019 | 72,779 | 4.8% | 95.2% |
| 2018 | 71,967 | 4.9% | 95.1% |
| 2017 | 71,454 | 5.1% | 94.9% |
| 2016 | 71,233 | 5.4% | 94.6% |
| 2015 | 71,419 | 5.7% | 94.3% |
| 2014 | 71,734 | 5.8% | 94.2% |
| 2013 | 72,092 | 6.0% | 94.0% |
| 2012 | 72,272 | 6.0% | 94.0% |
| 2011 | 72,348 | 5.7% | 94.3% |
| 2010 | 72,092 | 5.5% | 94.5% |
Nativity & Citizenship FAQs for Grays Harbor County, Washington
Approximately 5.6% of residents in Grays Harbor County, Washington were born outside the United States.
The vast majority of residents, roughly 96.6%, are U.S. citizens (including both native-born and naturalized citizens).