King County, Washington Nativity & Citizenship Status (2024)
Place of birth and citizenship status analysis for King County, Washington
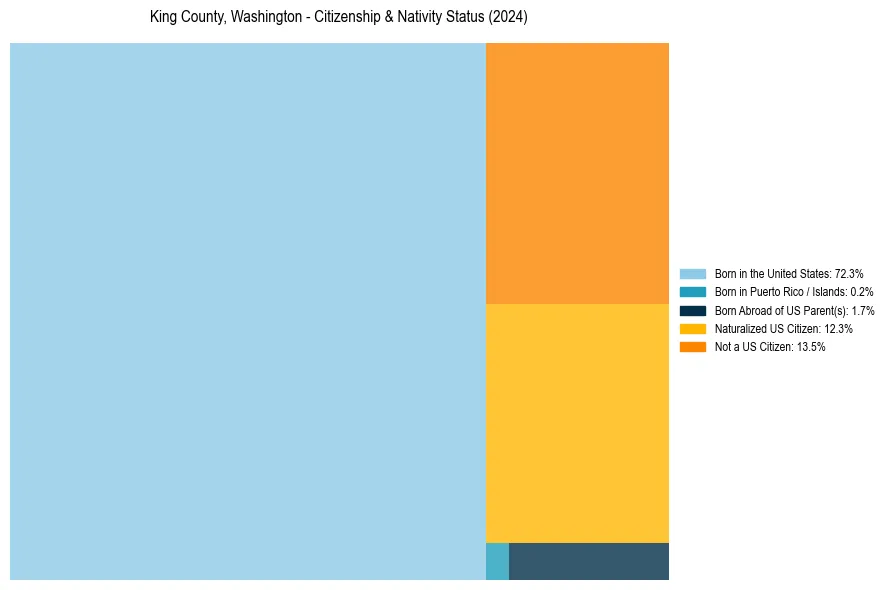
King County, Washington Nativity & Citizenship Indicators (2024)
Native Born
74.2%
Foreign Born
25.8%
Naturalized
12.3%
US Citizens
86.5%
King County, Washington Nativity & Citizenship Distribution
King County, Washington Historical Nativity Trends (2010–2024)
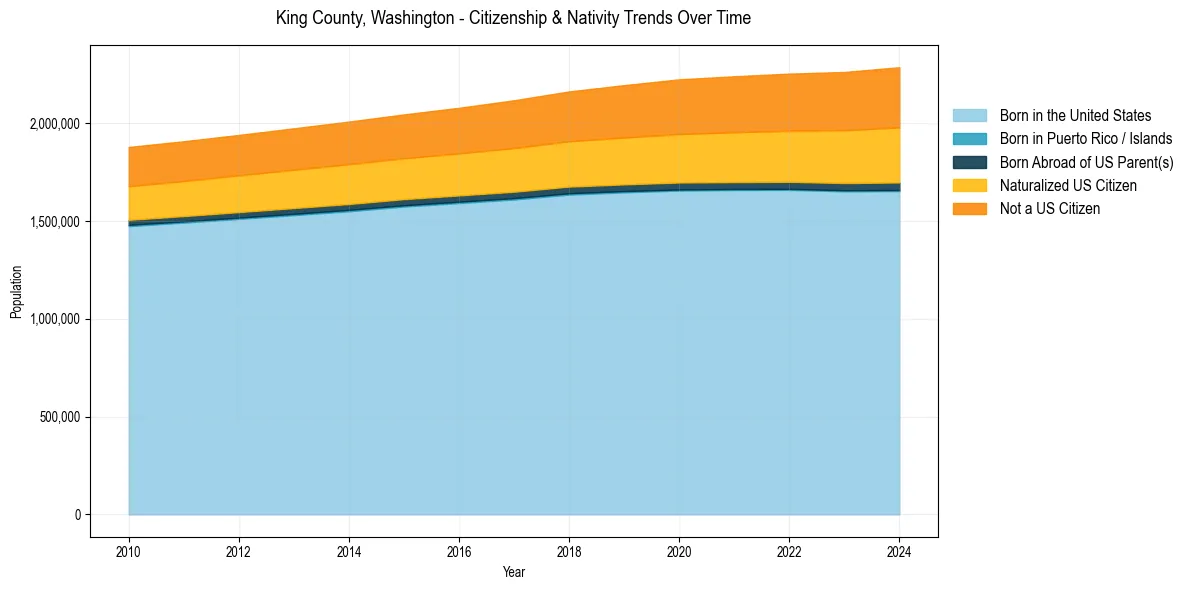
King County, Washington Population & Nativity History
| Year | Total Pop | Foreign Born | Native Born |
|---|---|---|---|
| 2024 | 2,287,171 | 25.8% | 74.2% |
| 2023 | 2,262,713 | 25.1% | 74.9% |
| 2022 | 2,254,371 | 24.5% | 75.5% |
| 2021 | 2,240,876 | 24.2% | 75.8% |
| 2020 | 2,225,064 | 23.7% | 76.3% |
| 2019 | 2,195,502 | 23.1% | 76.9% |
| 2018 | 2,163,257 | 22.5% | 77.5% |
| 2017 | 2,118,119 | 22.1% | 77.9% |
| 2016 | 2,079,550 | 21.6% | 78.4% |
| 2015 | 2,045,756 | 21.2% | 78.8% |
| 2014 | 2,008,997 | 21.0% | 79.0% |
| 2013 | 1,974,567 | 20.7% | 79.3% |
| 2012 | 1,940,777 | 20.3% | 79.7% |
| 2011 | 1,908,379 | 20.1% | 79.9% |
| 2010 | 1,879,189 | 19.8% | 80.2% |
Nativity & Citizenship FAQs for King County, Washington
Approximately 25.8% of residents in King County, Washington were born outside the United States.
The vast majority of residents, roughly 86.5%, are U.S. citizens (including both native-born and naturalized citizens).