Kitsap County, Washington Nativity & Citizenship Status (2024)
Place of birth and citizenship status analysis for Kitsap County, Washington
Kitsap County, Washington Nativity & Citizenship Indicators (2024)
Native Born
92.8%
Foreign Born
7.2%
Naturalized
4.4%
US Citizens
97.2%
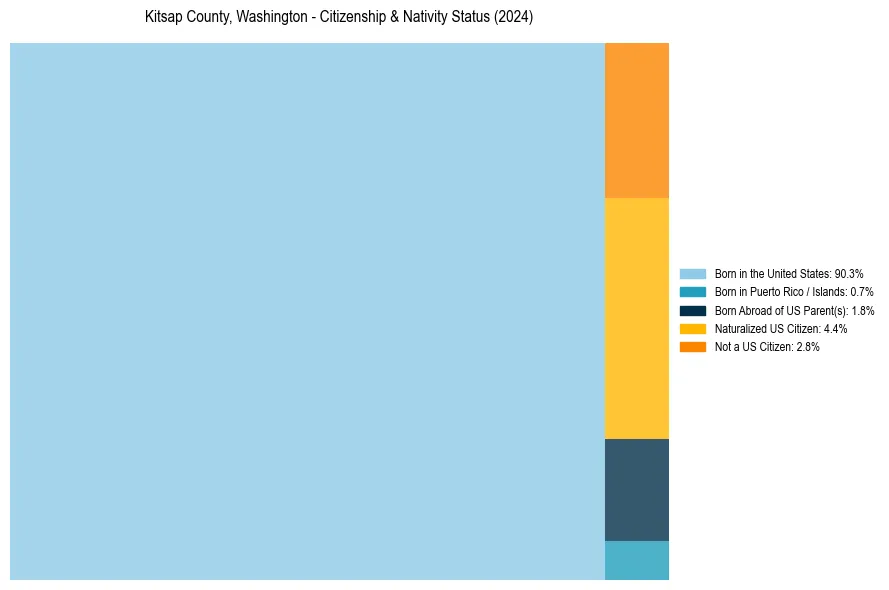
Kitsap County, Washington Nativity & Citizenship Distribution
Kitsap County, Washington Historical Nativity Trends (2010–2024)
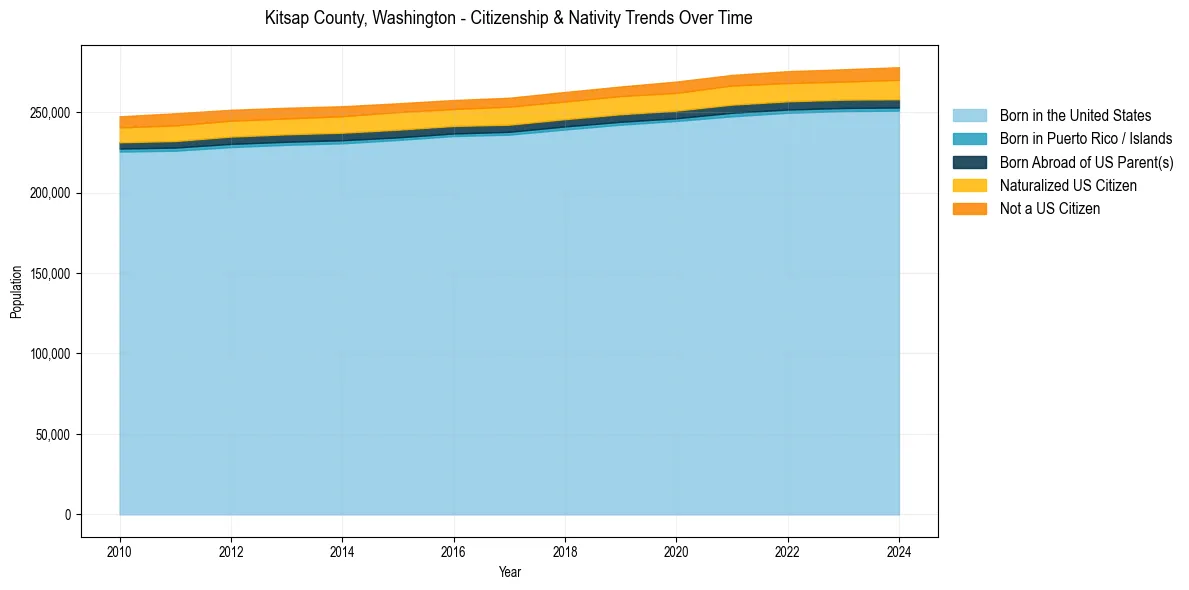
Kitsap County, Washington Population & Nativity History
| Year | Total Pop | Foreign Born | Native Born |
|---|---|---|---|
| 2024 | 277,881 | 7.2% | 92.8% |
| 2023 | 276,581 | 6.8% | 93.2% |
| 2022 | 275,411 | 6.8% | 93.2% |
| 2021 | 273,072 | 6.8% | 93.2% |
| 2020 | 268,945 | 6.7% | 93.3% |
| 2019 | 265,882 | 6.5% | 93.5% |
| 2018 | 262,475 | 6.4% | 93.6% |
| 2017 | 258,903 | 6.5% | 93.5% |
| 2016 | 257,488 | 6.3% | 93.7% |
| 2015 | 255,441 | 6.4% | 93.6% |
| 2014 | 253,614 | 6.5% | 93.5% |
| 2013 | 252,687 | 6.5% | 93.5% |
| 2012 | 251,400 | 6.6% | 93.4% |
| 2011 | 249,238 | 6.9% | 93.1% |
| 2010 | 247,336 | 6.5% | 93.5% |
Nativity & Citizenship FAQs for Kitsap County, Washington
Approximately 7.2% of residents in Kitsap County, Washington were born outside the United States.
The vast majority of residents, roughly 97.2%, are U.S. citizens (including both native-born and naturalized citizens).