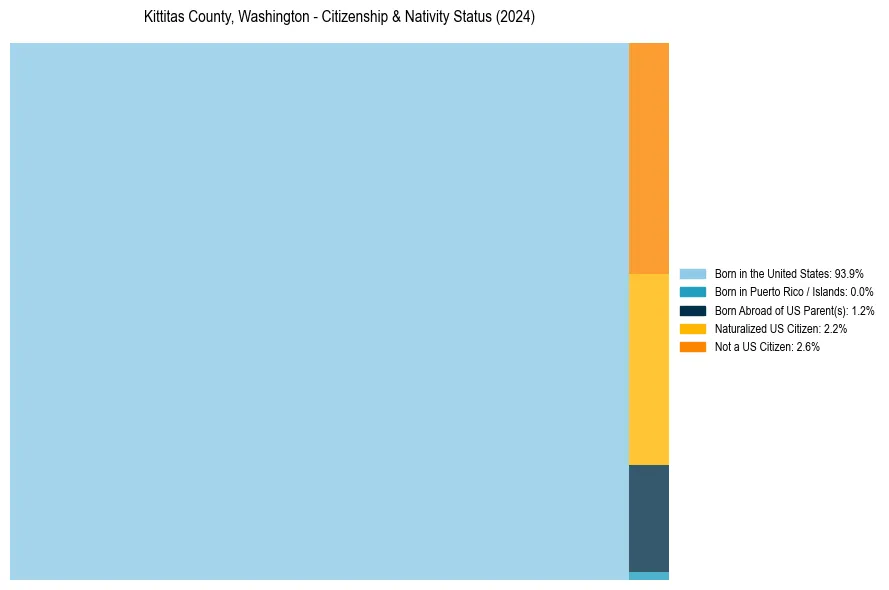
Kittitas County, Washington Nativity & Citizenship Status (2024)
Place of birth and citizenship status analysis for Kittitas County, Washington
Kittitas County, Washington Nativity & Citizenship Indicators (2024)
Native Born
95.2%
Foreign Born
4.8%
Naturalized
2.2%
US Citizens
97.4%
Kittitas County, Washington Nativity & Citizenship Distribution
Kittitas County, Washington Historical Nativity Trends (2010–2024)
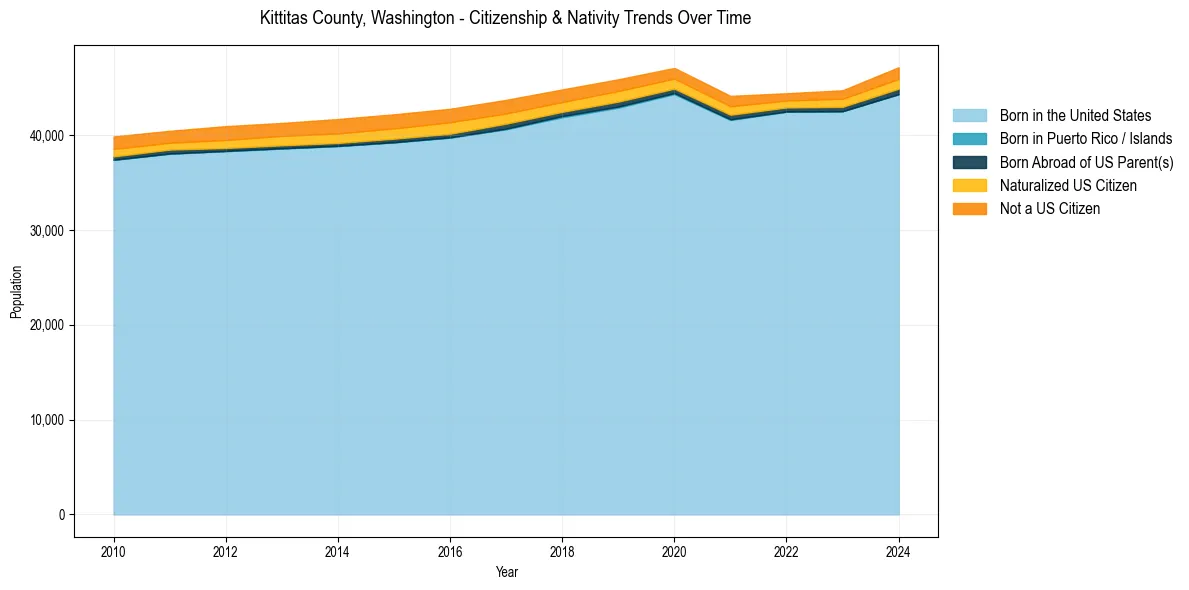
Kittitas County, Washington Population & Nativity History
| Year | Total Pop | Foreign Born | Native Born |
|---|---|---|---|
| 2024 | 47,172 | 4.8% | 95.2% |
| 2023 | 44,736 | 3.9% | 96.1% |
| 2022 | 44,424 | 3.4% | 96.6% |
| 2021 | 44,147 | 4.5% | 95.5% |
| 2020 | 47,097 | 4.7% | 95.3% |
| 2019 | 45,897 | 5.1% | 94.9% |
| 2018 | 44,825 | 5.3% | 94.7% |
| 2017 | 43,726 | 5.7% | 94.3% |
| 2016 | 42,785 | 6.2% | 93.8% |
| 2015 | 42,204 | 6.1% | 93.9% |
| 2014 | 41,705 | 6.1% | 93.9% |
| 2013 | 41,291 | 5.7% | 94.3% |
| 2012 | 40,954 | 5.6% | 94.4% |
| 2011 | 40,461 | 4.9% | 95.1% |
| 2010 | 39,869 | 5.3% | 94.7% |
Nativity & Citizenship FAQs for Kittitas County, Washington
Approximately 4.8% of residents in Kittitas County, Washington were born outside the United States.
The vast majority of residents, roughly 97.4%, are U.S. citizens (including both native-born and naturalized citizens).