Lewis County, Washington Nativity & Citizenship Status (2024)
Place of birth and citizenship status analysis for Lewis County, Washington
Lewis County, Washington Nativity & Citizenship Indicators (2024)
Native Born
94.7%
Foreign Born
5.3%
Naturalized
2.4%
US Citizens
97.1%
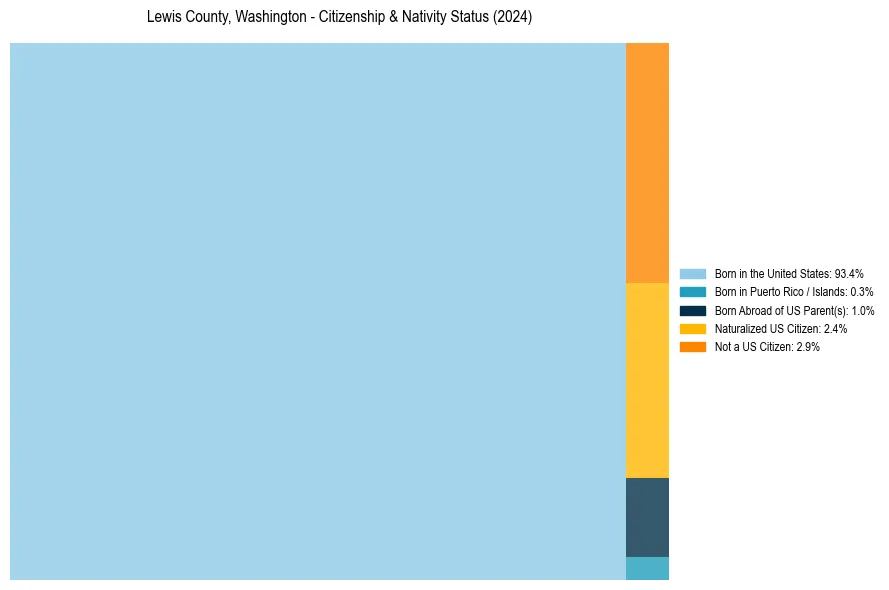
Lewis County, Washington Nativity & Citizenship Distribution
Lewis County, Washington Historical Nativity Trends (2010–2024)
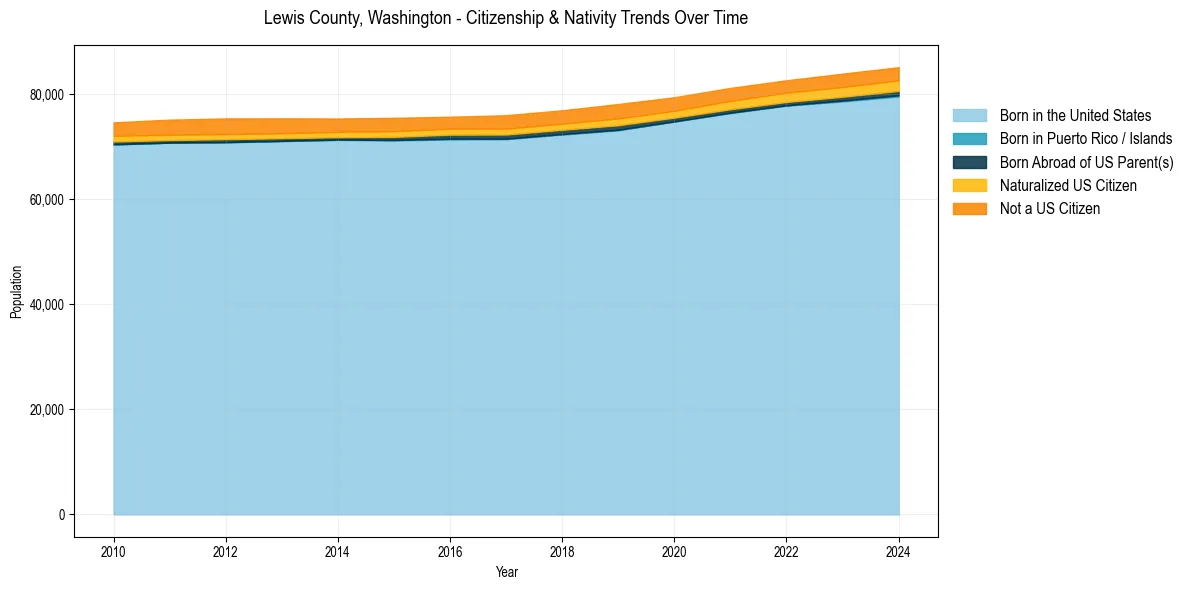
Lewis County, Washington Population & Nativity History
| Year | Total Pop | Foreign Born | Native Born |
|---|---|---|---|
| 2024 | 85,154 | 5.3% | 94.7% |
| 2023 | 83,925 | 5.3% | 94.7% |
| 2022 | 82,663 | 5.0% | 95.0% |
| 2021 | 81,214 | 5.0% | 95.0% |
| 2020 | 79,430 | 4.9% | 95.1% |
| 2019 | 78,145 | 5.2% | 94.8% |
| 2018 | 76,947 | 4.8% | 95.2% |
| 2017 | 76,012 | 4.8% | 95.2% |
| 2016 | 75,724 | 4.5% | 95.5% |
| 2015 | 75,515 | 4.8% | 95.2% |
| 2014 | 75,382 | 4.7% | 95.3% |
| 2013 | 75,419 | 5.0% | 95.0% |
| 2012 | 75,399 | 5.2% | 94.8% |
| 2011 | 75,167 | 5.2% | 94.8% |
| 2010 | 74,650 | 4.9% | 95.1% |
Nativity & Citizenship FAQs for Lewis County, Washington
Approximately 5.3% of residents in Lewis County, Washington were born outside the United States.
The vast majority of residents, roughly 97.1%, are U.S. citizens (including both native-born and naturalized citizens).