Mason County, Washington Nativity & Citizenship Status (2024)
Place of birth and citizenship status analysis for Mason County, Washington
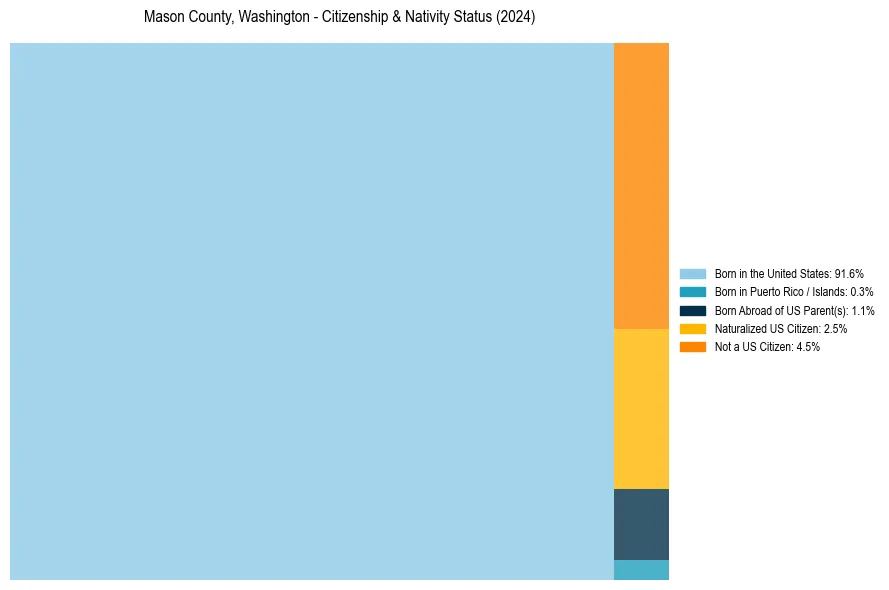
Mason County, Washington Nativity & Citizenship Indicators (2024)
Native Born
93.0%
Foreign Born
7.0%
Naturalized
2.5%
US Citizens
95.5%
Mason County, Washington Nativity & Citizenship Distribution
Mason County, Washington Historical Nativity Trends (2010–2024)
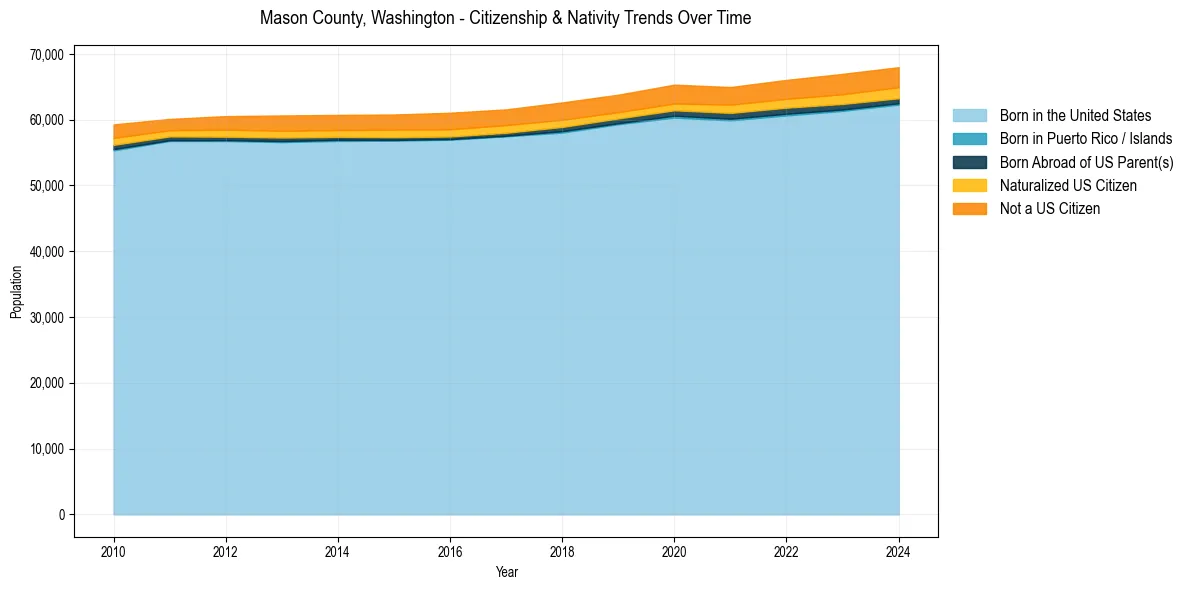
Mason County, Washington Population & Nativity History
| Year | Total Pop | Foreign Born | Native Born |
|---|---|---|---|
| 2024 | 67,982 | 7.0% | 93.0% |
| 2023 | 66,968 | 6.8% | 93.2% |
| 2022 | 66,053 | 6.4% | 93.6% |
| 2021 | 64,964 | 6.1% | 93.9% |
| 2020 | 65,326 | 6.0% | 94.0% |
| 2019 | 63,804 | 5.7% | 94.3% |
| 2018 | 62,627 | 6.0% | 94.0% |
| 2017 | 61,569 | 5.8% | 94.2% |
| 2016 | 61,060 | 5.9% | 94.1% |
| 2015 | 60,791 | 5.7% | 94.3% |
| 2014 | 60,728 | 5.5% | 94.5% |
| 2013 | 60,647 | 5.5% | 94.5% |
| 2012 | 60,545 | 5.2% | 94.8% |
| 2011 | 60,116 | 4.4% | 95.6% |
| 2010 | 59,287 | 5.3% | 94.7% |
Nativity & Citizenship FAQs for Mason County, Washington
Approximately 7.0% of residents in Mason County, Washington were born outside the United States.
The vast majority of residents, roughly 95.5%, are U.S. citizens (including both native-born and naturalized citizens).