Washington Nativity & Citizenship Status (2024)
Place of birth and citizenship status analysis for Washington
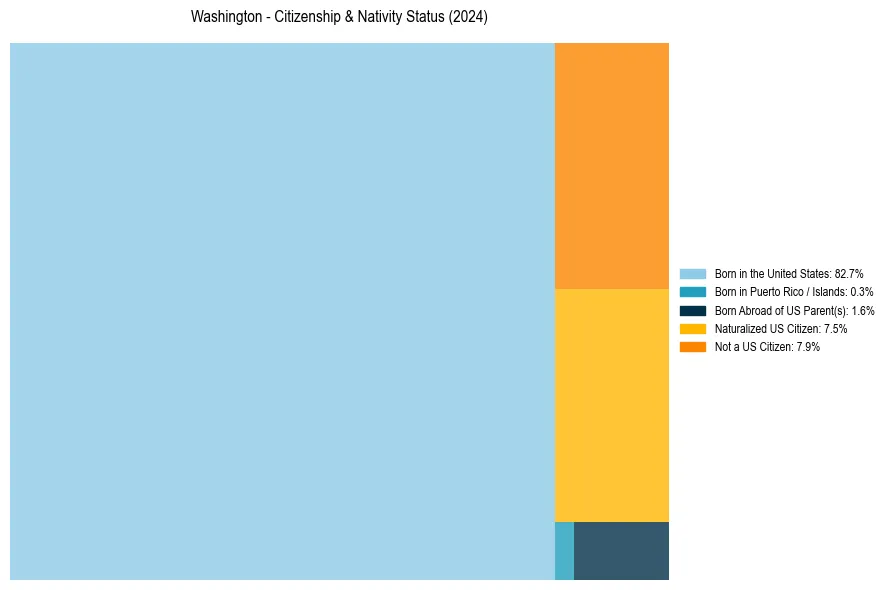
Washington Nativity & Citizenship Indicators (2024)
Native Born
84.6%
Foreign Born
15.4%
Naturalized
7.5%
US Citizens
92.1%
Washington Nativity & Citizenship Distribution
Washington Historical Nativity Trends (2010–2024)
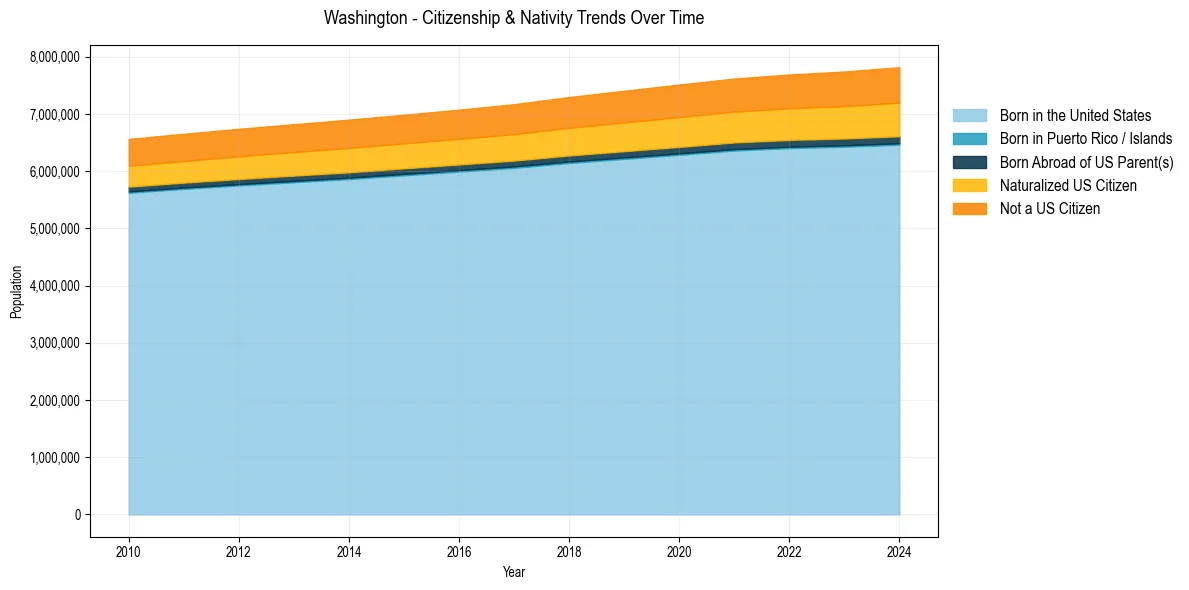
Washington Population & Nativity History
| Year | Total Pop | Foreign Born | Native Born |
|---|---|---|---|
| 2024 | 7,816,116 | 15.4% | 84.6% |
| 2023 | 7,740,984 | 15.1% | 84.9% |
| 2022 | 7,688,549 | 14.9% | 85.1% |
| 2021 | 7,617,364 | 14.7% | 85.3% |
| 2020 | 7,512,465 | 14.5% | 85.5% |
| 2019 | 7,404,107 | 14.3% | 85.7% |
| 2018 | 7,294,336 | 14.0% | 86.0% |
| 2017 | 7,169,967 | 13.8% | 86.2% |
| 2016 | 7,073,146 | 13.5% | 86.5% |
| 2015 | 6,985,464 | 13.4% | 86.6% |
| 2014 | 6,899,123 | 13.3% | 86.7% |
| 2013 | 6,819,579 | 13.2% | 86.8% |
| 2012 | 6,738,714 | 13.0% | 87.0% |
| 2011 | 6,652,845 | 12.8% | 87.2% |
| 2010 | 6,561,297 | 12.7% | 87.3% |
Nativity & Citizenship FAQs for Washington
Approximately 15.4% of residents in Washington were born outside the United States.
The vast majority of residents, roughly 92.1%, are U.S. citizens (including both native-born and naturalized citizens).