Okanogan County, Washington Nativity & Citizenship Status (2024)
Place of birth and citizenship status analysis for Okanogan County, Washington
Okanogan County, Washington Nativity & Citizenship Indicators (2024)
Native Born
86.8%
Foreign Born
13.2%
Naturalized
3.6%
US Citizens
90.4%
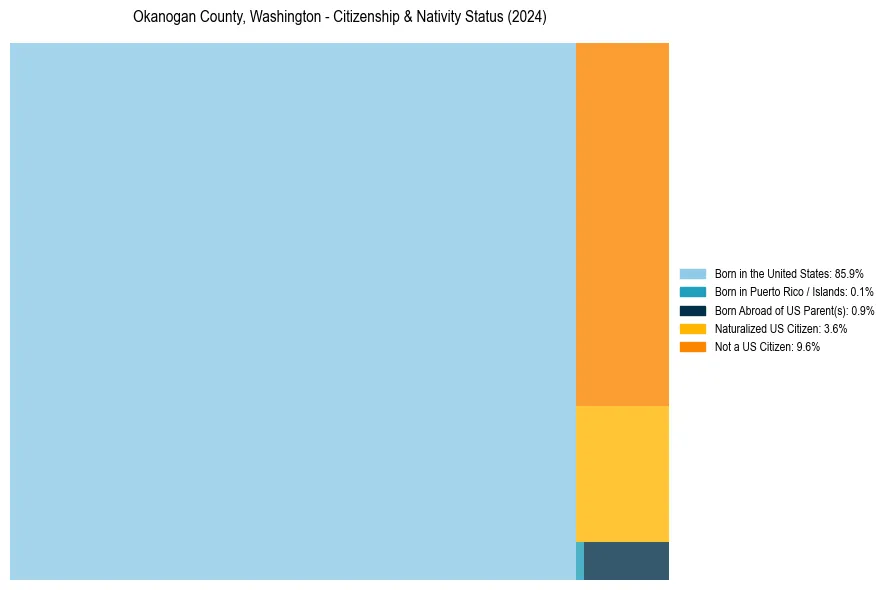
Okanogan County, Washington Nativity & Citizenship Distribution
Okanogan County, Washington Historical Nativity Trends (2010–2024)
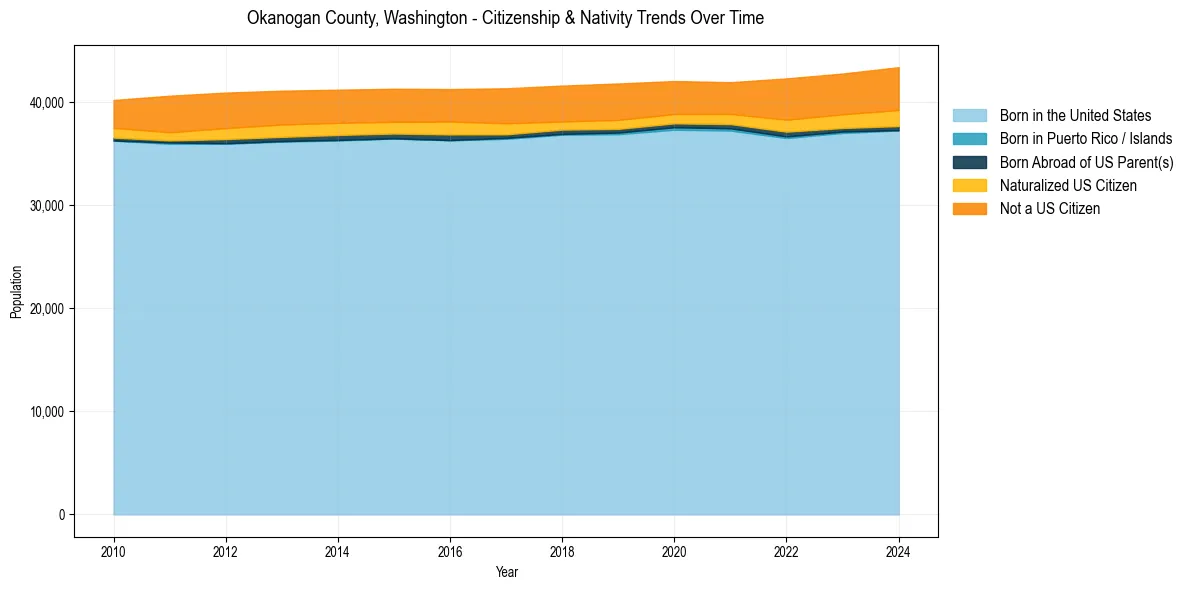
Okanogan County, Washington Population & Nativity History
| Year | Total Pop | Foreign Born | Native Born |
|---|---|---|---|
| 2024 | 43,425 | 13.2% | 86.8% |
| 2023 | 42,811 | 12.4% | 87.6% |
| 2022 | 42,336 | 12.2% | 87.8% |
| 2021 | 41,966 | 9.7% | 90.3% |
| 2020 | 42,080 | 9.8% | 90.2% |
| 2019 | 41,842 | 10.5% | 89.5% |
| 2018 | 41,638 | 10.3% | 89.7% |
| 2017 | 41,377 | 10.8% | 89.2% |
| 2016 | 41,299 | 10.7% | 89.3% |
| 2015 | 41,332 | 10.5% | 89.5% |
| 2014 | 41,241 | 10.7% | 89.3% |
| 2013 | 41,143 | 10.9% | 89.1% |
| 2012 | 40,959 | 11.0% | 89.0% |
| 2011 | 40,655 | 10.7% | 89.3% |
| 2010 | 40,238 | 9.1% | 90.9% |
Nativity & Citizenship FAQs for Okanogan County, Washington
Approximately 13.2% of residents in Okanogan County, Washington were born outside the United States.
The vast majority of residents, roughly 90.4%, are U.S. citizens (including both native-born and naturalized citizens).