Pierce County, Washington Nativity & Citizenship Status (2024)
Place of birth and citizenship status analysis for Pierce County, Washington
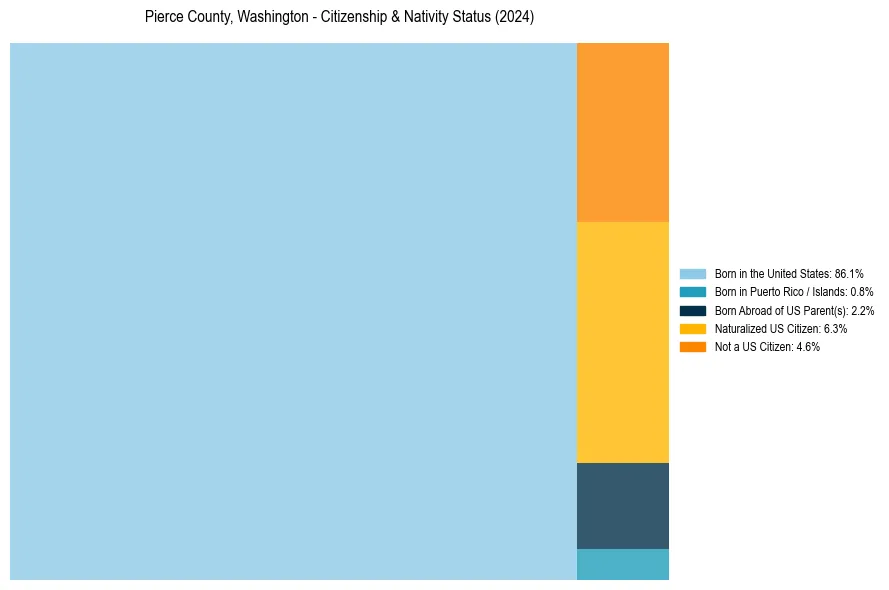
Pierce County, Washington Nativity & Citizenship Indicators (2024)
Native Born
89.1%
Foreign Born
10.9%
Naturalized
6.3%
US Citizens
95.4%
Pierce County, Washington Nativity & Citizenship Distribution
Pierce County, Washington Historical Nativity Trends (2010–2024)
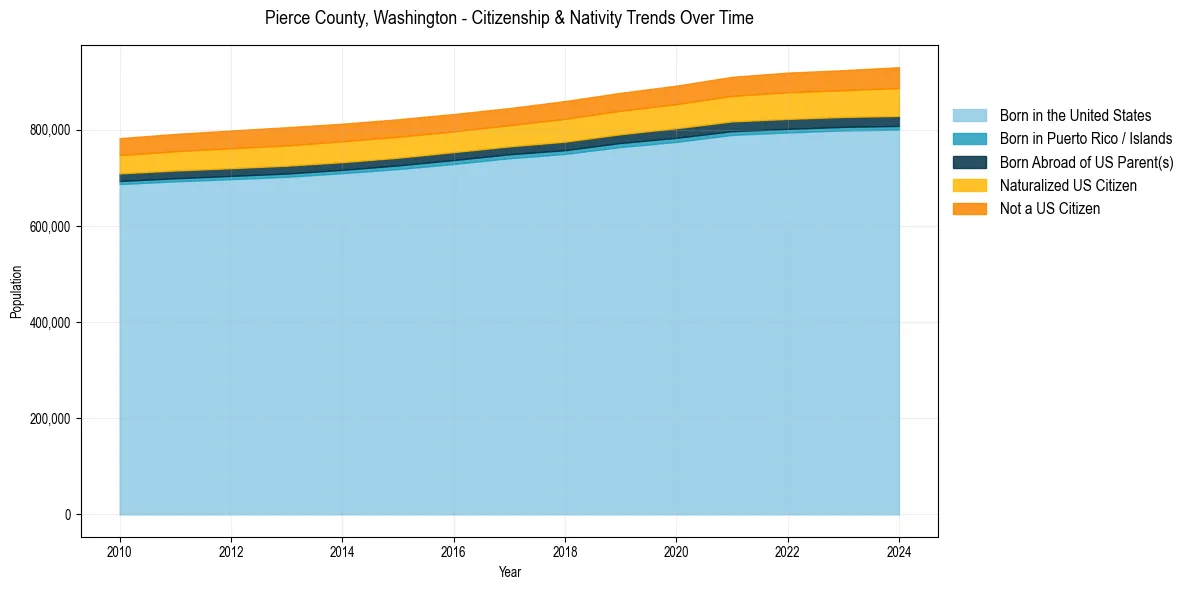
Pierce County, Washington Population & Nativity History
| Year | Total Pop | Foreign Born | Native Born |
|---|---|---|---|
| 2024 | 930,319 | 10.9% | 89.1% |
| 2023 | 924,106 | 10.5% | 89.5% |
| 2022 | 918,993 | 10.5% | 89.5% |
| 2021 | 910,225 | 10.2% | 89.8% |
| 2020 | 891,862 | 9.9% | 90.1% |
| 2019 | 877,013 | 9.8% | 90.2% |
| 2018 | 859,840 | 9.8% | 90.2% |
| 2017 | 845,193 | 9.4% | 90.6% |
| 2016 | 832,896 | 9.5% | 90.5% |
| 2015 | 821,952 | 9.7% | 90.3% |
| 2014 | 812,689 | 9.8% | 90.2% |
| 2013 | 805,434 | 9.9% | 90.1% |
| 2012 | 798,528 | 9.8% | 90.2% |
| 2011 | 791,528 | 9.6% | 90.4% |
| 2010 | 782,681 | 9.4% | 90.6% |
Nativity & Citizenship FAQs for Pierce County, Washington
Approximately 10.9% of residents in Pierce County, Washington were born outside the United States.
The vast majority of residents, roughly 95.4%, are U.S. citizens (including both native-born and naturalized citizens).