Snohomish County, Washington Nativity & Citizenship Status (2024)
Place of birth and citizenship status analysis for Snohomish County, Washington
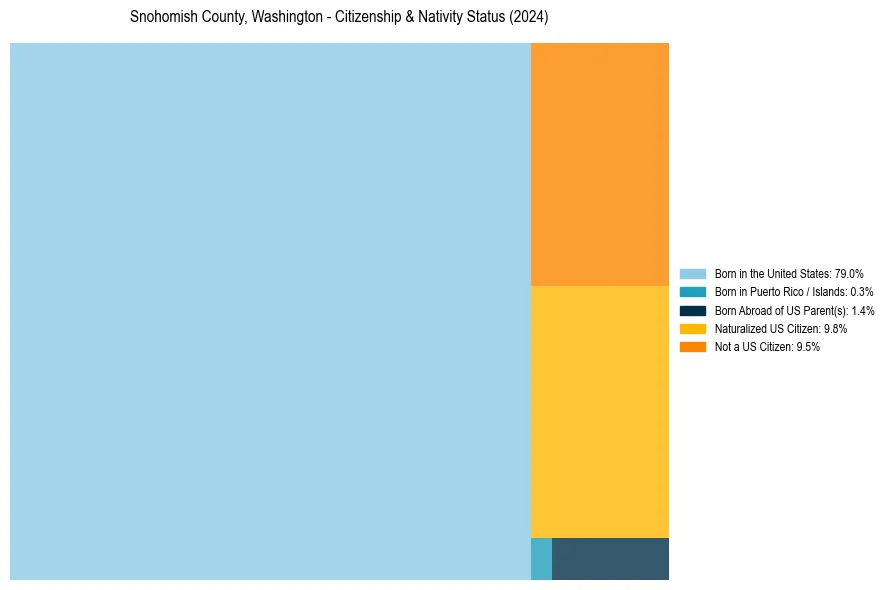
Snohomish County, Washington Nativity & Citizenship Indicators (2024)
Native Born
80.7%
Foreign Born
19.3%
Naturalized
9.8%
US Citizens
90.5%
Snohomish County, Washington Nativity & Citizenship Distribution
Snohomish County, Washington Historical Nativity Trends (2010–2024)
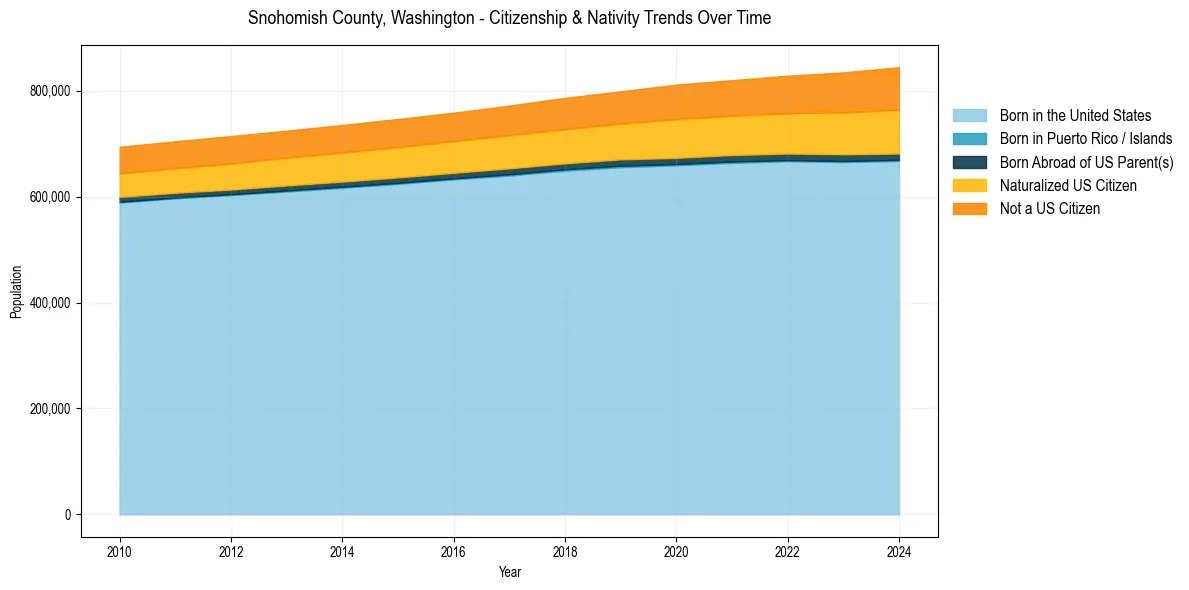
Snohomish County, Washington Population & Nativity History
| Year | Total Pop | Foreign Born | Native Born |
|---|---|---|---|
| 2024 | 844,430 | 19.3% | 80.7% |
| 2023 | 834,648 | 18.5% | 81.5% |
| 2022 | 828,337 | 17.7% | 82.3% |
| 2021 | 820,024 | 17.2% | 82.8% |
| 2020 | 811,572 | 17.0% | 83.0% |
| 2019 | 798,808 | 16.1% | 83.9% |
| 2018 | 786,620 | 15.7% | 84.3% |
| 2017 | 771,904 | 15.3% | 84.7% |
| 2016 | 758,649 | 15.0% | 85.0% |
| 2015 | 746,653 | 14.8% | 85.2% |
| 2014 | 735,351 | 14.5% | 85.5% |
| 2013 | 724,627 | 14.3% | 85.7% |
| 2012 | 714,443 | 14.1% | 85.9% |
| 2011 | 704,536 | 13.8% | 86.2% |
| 2010 | 694,219 | 13.6% | 86.4% |
Nativity & Citizenship FAQs for Snohomish County, Washington
Approximately 19.3% of residents in Snohomish County, Washington were born outside the United States.
The vast majority of residents, roughly 90.5%, are U.S. citizens (including both native-born and naturalized citizens).