Spokane County, Washington Nativity & Citizenship Status (2024)
Place of birth and citizenship status analysis for Spokane County, Washington
Spokane County, Washington Nativity & Citizenship Indicators (2024)
Native Born
94.6%
Foreign Born
5.4%
Naturalized
3.1%
US Citizens
97.7%
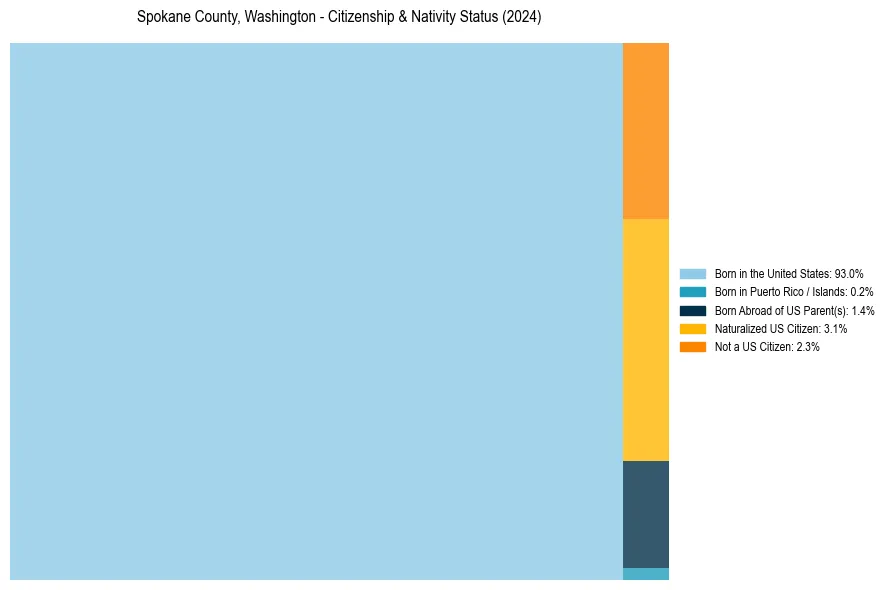
Spokane County, Washington Nativity & Citizenship Distribution
Spokane County, Washington Historical Nativity Trends (2010–2024)
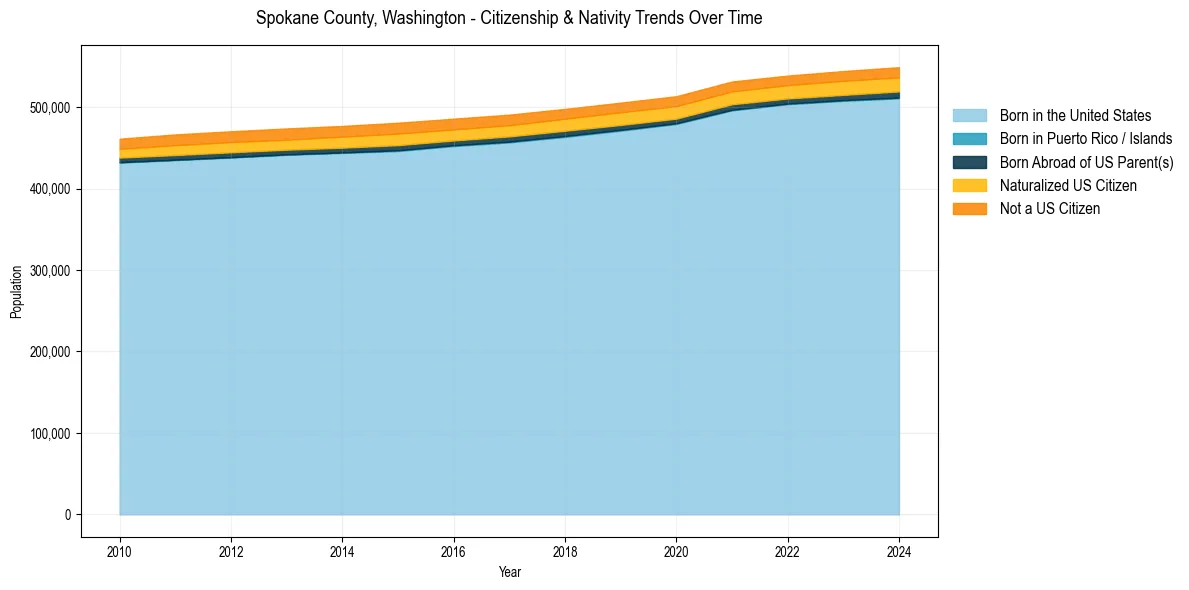
Spokane County, Washington Population & Nativity History
| Year | Total Pop | Foreign Born | Native Born |
|---|---|---|---|
| 2024 | 549,056 | 5.4% | 94.6% |
| 2023 | 544,323 | 5.4% | 94.6% |
| 2022 | 538,711 | 5.2% | 94.8% |
| 2021 | 531,477 | 5.3% | 94.7% |
| 2020 | 513,402 | 5.4% | 94.6% |
| 2019 | 505,505 | 5.4% | 94.6% |
| 2018 | 497,875 | 5.4% | 94.6% |
| 2017 | 490,764 | 5.4% | 94.6% |
| 2016 | 485,859 | 5.5% | 94.5% |
| 2015 | 480,832 | 5.7% | 94.3% |
| 2014 | 476,950 | 5.6% | 94.4% |
| 2013 | 473,832 | 5.5% | 94.5% |
| 2012 | 470,375 | 5.5% | 94.5% |
| 2011 | 466,497 | 5.4% | 94.6% |
| 2010 | 461,262 | 5.0% | 95.0% |
Nativity & Citizenship FAQs for Spokane County, Washington
Approximately 5.4% of residents in Spokane County, Washington were born outside the United States.
The vast majority of residents, roughly 97.7%, are U.S. citizens (including both native-born and naturalized citizens).