Thurston County, Washington Nativity & Citizenship Status (2024)
Place of birth and citizenship status analysis for Thurston County, Washington
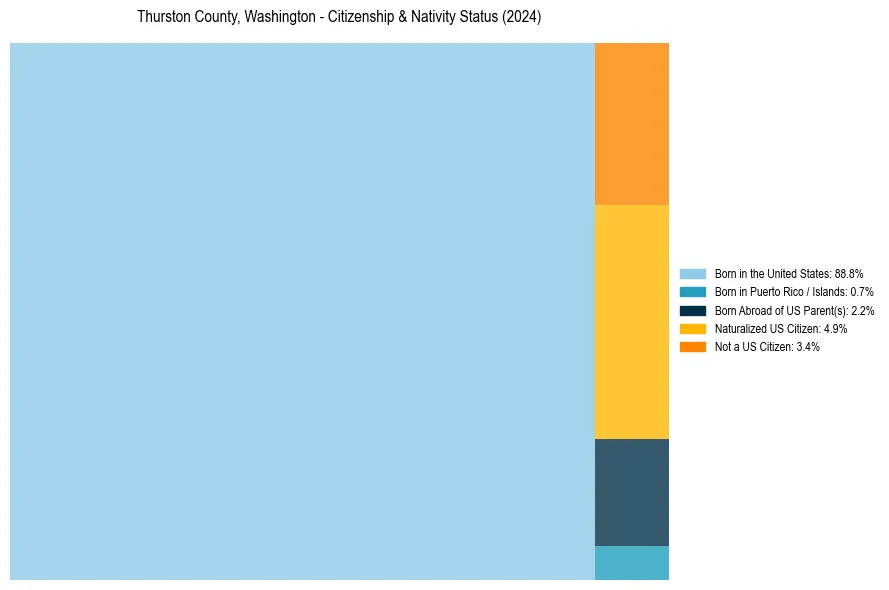
Thurston County, Washington Nativity & Citizenship Indicators (2024)
Native Born
91.7%
Foreign Born
8.3%
Naturalized
4.9%
US Citizens
96.6%
Thurston County, Washington Nativity & Citizenship Distribution
Thurston County, Washington Historical Nativity Trends (2010–2024)
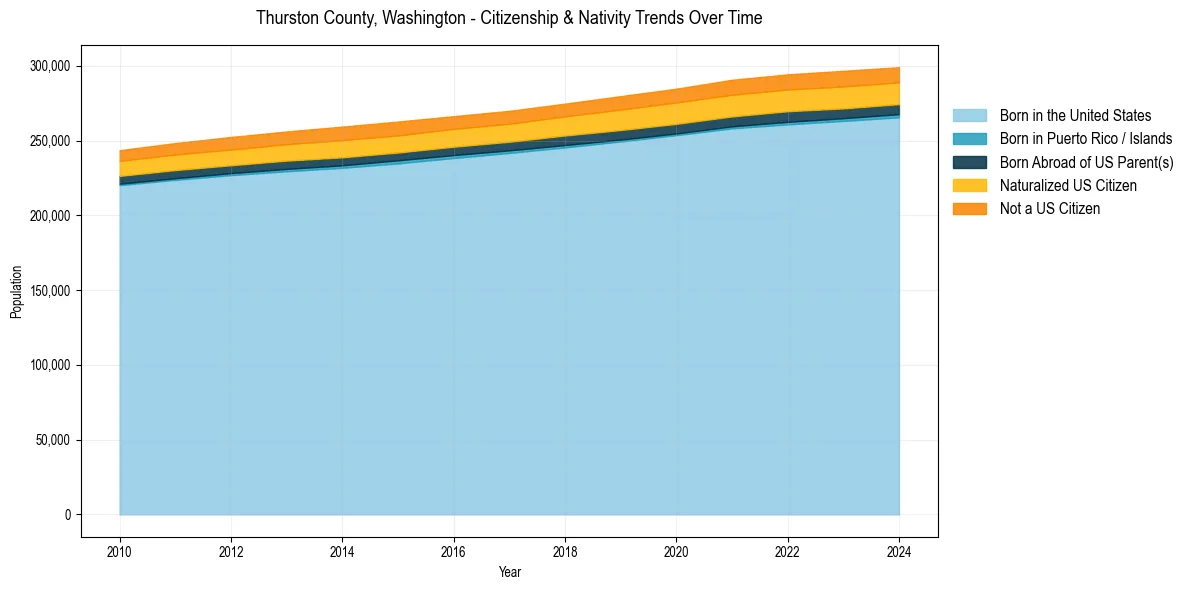
Thurston County, Washington Population & Nativity History
| Year | Total Pop | Foreign Born | Native Born |
|---|---|---|---|
| 2024 | 299,067 | 8.3% | 91.7% |
| 2023 | 296,640 | 8.5% | 91.5% |
| 2022 | 294,272 | 8.4% | 91.6% |
| 2021 | 290,642 | 8.4% | 91.6% |
| 2020 | 284,698 | 8.3% | 91.7% |
| 2019 | 279,711 | 8.1% | 91.9% |
| 2018 | 274,684 | 7.8% | 92.2% |
| 2017 | 269,885 | 7.7% | 92.3% |
| 2016 | 266,311 | 7.7% | 92.3% |
| 2015 | 262,723 | 7.9% | 92.1% |
| 2014 | 259,330 | 7.9% | 92.1% |
| 2013 | 256,080 | 7.6% | 92.4% |
| 2012 | 252,410 | 7.5% | 92.5% |
| 2011 | 248,327 | 7.3% | 92.7% |
| 2010 | 243,563 | 7.1% | 92.9% |
Nativity & Citizenship FAQs for Thurston County, Washington
Approximately 8.3% of residents in Thurston County, Washington were born outside the United States.
The vast majority of residents, roughly 96.6%, are U.S. citizens (including both native-born and naturalized citizens).