Walla Walla County, Washington Nativity & Citizenship Status (2024)
Place of birth and citizenship status analysis for Walla Walla County, Washington
Walla Walla County, Washington Nativity & Citizenship Indicators (2024)
Native Born
90.5%
Foreign Born
9.5%
Naturalized
4.2%
US Citizens
94.7%
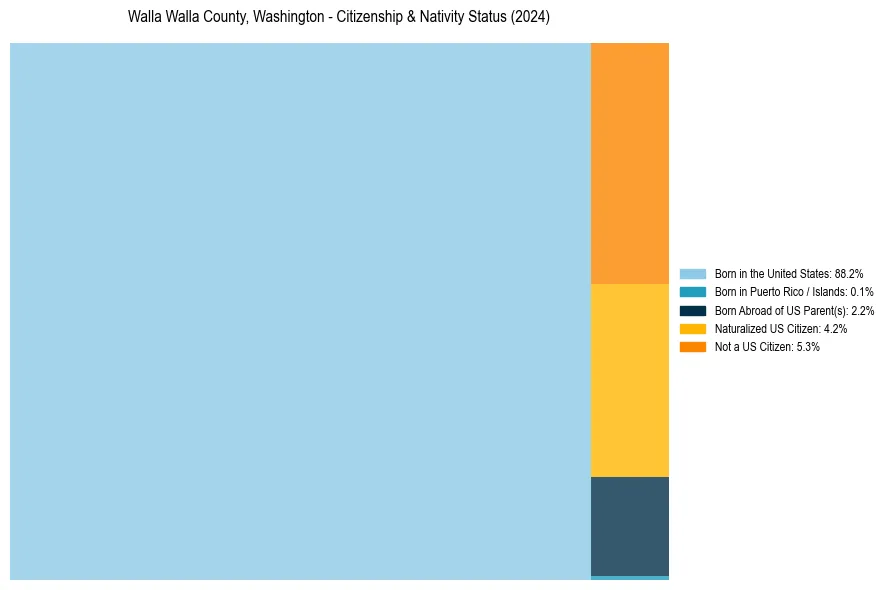
Walla Walla County, Washington Nativity & Citizenship Distribution
Walla Walla County, Washington Historical Nativity Trends (2010–2024)
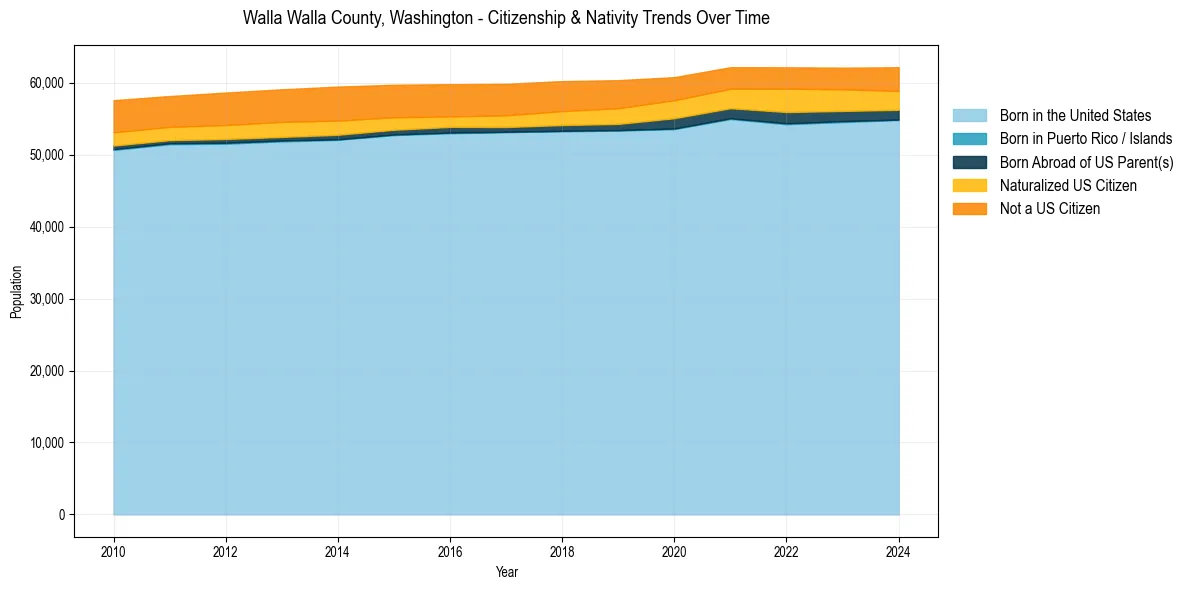
Walla Walla County, Washington Population & Nativity History
| Year | Total Pop | Foreign Born | Native Born |
|---|---|---|---|
| 2024 | 62,161 | 9.5% | 90.5% |
| 2023 | 62,102 | 9.7% | 90.3% |
| 2022 | 62,150 | 10.0% | 90.0% |
| 2021 | 62,168 | 9.2% | 90.8% |
| 2020 | 60,785 | 9.4% | 90.6% |
| 2019 | 60,365 | 10.1% | 89.9% |
| 2018 | 60,236 | 10.1% | 89.9% |
| 2017 | 59,862 | 10.0% | 90.0% |
| 2016 | 59,809 | 9.9% | 90.1% |
| 2015 | 59,726 | 10.5% | 89.5% |
| 2014 | 59,476 | 11.3% | 88.7% |
| 2013 | 59,092 | 11.2% | 88.8% |
| 2012 | 58,643 | 11.0% | 89.0% |
| 2011 | 58,154 | 10.5% | 89.5% |
| 2010 | 57,585 | 11.0% | 89.0% |
Nativity & Citizenship FAQs for Walla Walla County, Washington
Approximately 9.5% of residents in Walla Walla County, Washington were born outside the United States.
The vast majority of residents, roughly 94.7%, are U.S. citizens (including both native-born and naturalized citizens).