Whatcom County, Washington Nativity & Citizenship Status (2024)
Place of birth and citizenship status analysis for Whatcom County, Washington
Whatcom County, Washington Nativity & Citizenship Indicators (2024)
Native Born
90.1%
Foreign Born
9.9%
Naturalized
5.6%
US Citizens
95.6%
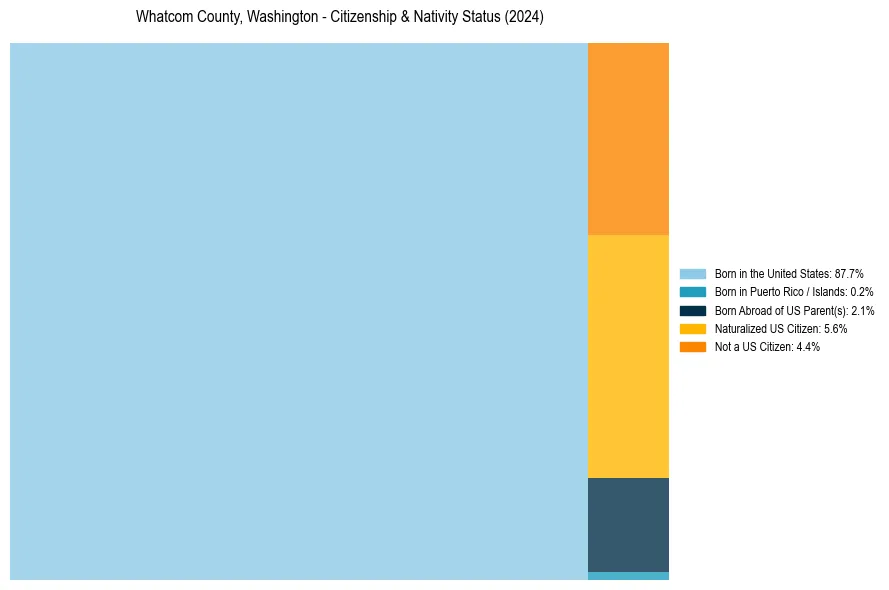
Whatcom County, Washington Nativity & Citizenship Distribution
Whatcom County, Washington Historical Nativity Trends (2010–2024)
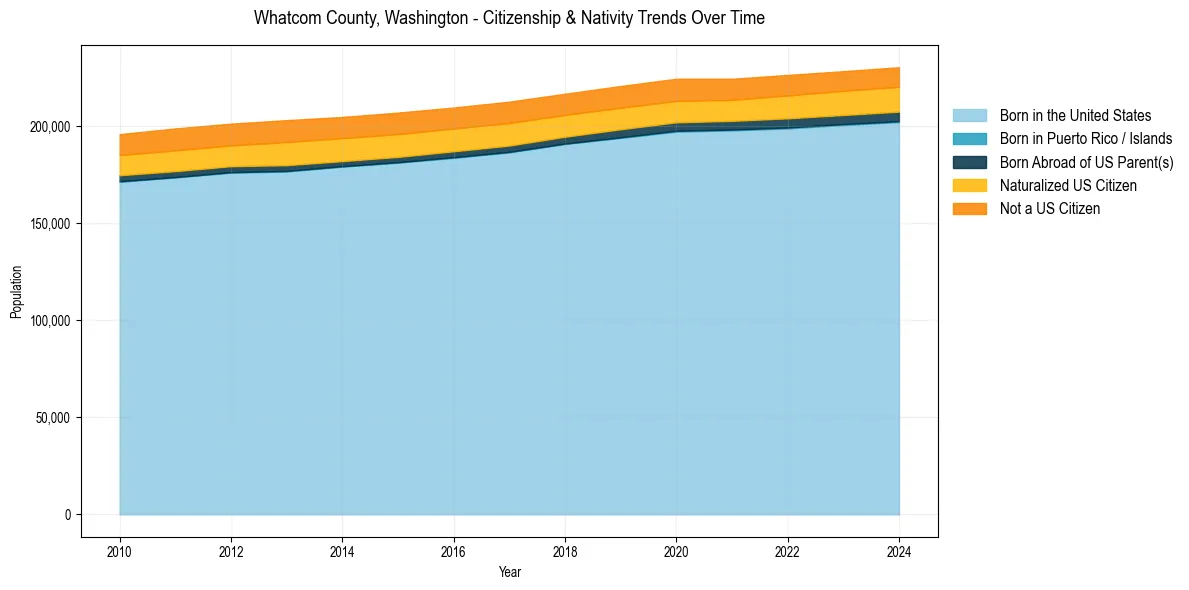
Whatcom County, Washington Population & Nativity History
| Year | Total Pop | Foreign Born | Native Born |
|---|---|---|---|
| 2024 | 230,503 | 9.9% | 90.1% |
| 2023 | 228,432 | 9.9% | 90.1% |
| 2022 | 226,523 | 9.9% | 90.1% |
| 2021 | 224,533 | 9.7% | 90.3% |
| 2020 | 224,538 | 10.0% | 90.0% |
| 2019 | 220,821 | 10.1% | 89.9% |
| 2018 | 216,812 | 10.2% | 89.8% |
| 2017 | 212,738 | 10.6% | 89.4% |
| 2016 | 209,729 | 10.8% | 89.2% |
| 2015 | 207,100 | 11.0% | 89.0% |
| 2014 | 204,855 | 11.1% | 88.9% |
| 2013 | 203,211 | 11.4% | 88.6% |
| 2012 | 201,404 | 10.9% | 89.1% |
| 2011 | 198,937 | 11.1% | 88.9% |
| 2010 | 195,993 | 10.8% | 89.2% |
Nativity & Citizenship FAQs for Whatcom County, Washington
Approximately 9.9% of residents in Whatcom County, Washington were born outside the United States.
The vast majority of residents, roughly 95.6%, are U.S. citizens (including both native-born and naturalized citizens).