Whitman County, Washington Nativity & Citizenship Status (2024)
Place of birth and citizenship status analysis for Whitman County, Washington
Whitman County, Washington Nativity & Citizenship Indicators (2024)
Native Born
92.5%
Foreign Born
7.5%
Naturalized
2.7%
US Citizens
95.2%
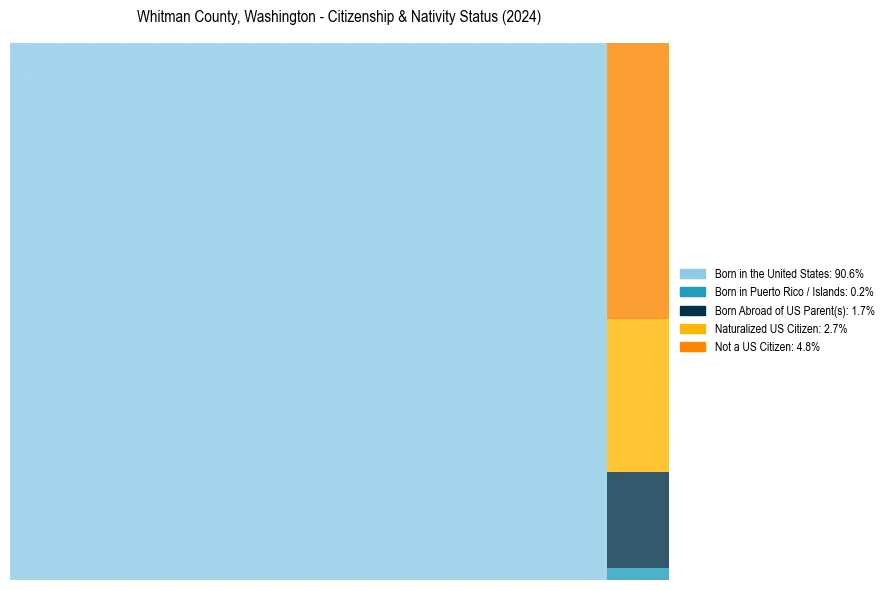
Whitman County, Washington Nativity & Citizenship Distribution
Whitman County, Washington Historical Nativity Trends (2010–2024)
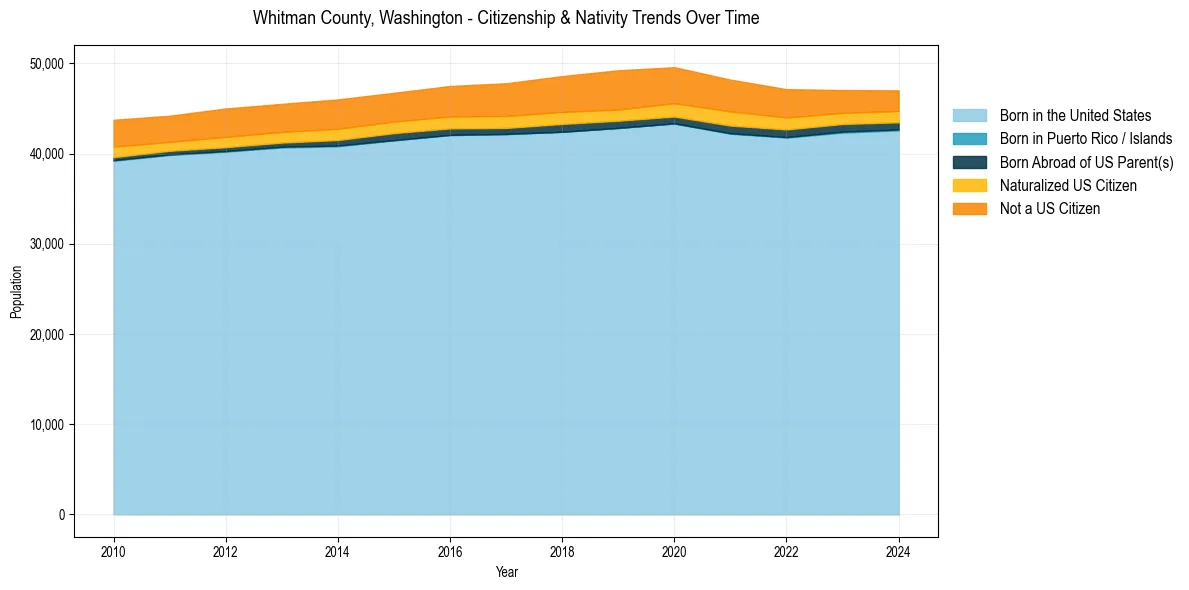
Whitman County, Washington Population & Nativity History
| Year | Total Pop | Foreign Born | Native Born |
|---|---|---|---|
| 2024 | 47,003 | 7.5% | 92.5% |
| 2023 | 47,042 | 8.0% | 92.0% |
| 2022 | 47,141 | 9.5% | 90.5% |
| 2021 | 48,197 | 10.6% | 89.4% |
| 2020 | 49,577 | 11.0% | 89.0% |
| 2019 | 49,231 | 11.3% | 88.7% |
| 2018 | 48,593 | 10.9% | 89.1% |
| 2017 | 47,794 | 10.4% | 89.6% |
| 2016 | 47,494 | 9.9% | 90.1% |
| 2015 | 46,737 | 9.6% | 90.4% |
| 2014 | 46,003 | 9.8% | 90.2% |
| 2013 | 45,512 | 9.4% | 90.6% |
| 2012 | 44,997 | 9.5% | 90.5% |
| 2011 | 44,200 | 8.8% | 91.2% |
| 2010 | 43,747 | 9.5% | 90.5% |
Nativity & Citizenship FAQs for Whitman County, Washington
Approximately 7.5% of residents in Whitman County, Washington were born outside the United States.
The vast majority of residents, roughly 95.2%, are U.S. citizens (including both native-born and naturalized citizens).