Yakima County, Washington Nativity & Citizenship Status (2024)
Place of birth and citizenship status analysis for Yakima County, Washington
Yakima County, Washington Nativity & Citizenship Indicators (2024)
Native Born
81.8%
Foreign Born
18.2%
Naturalized
6.0%
US Citizens
87.8%
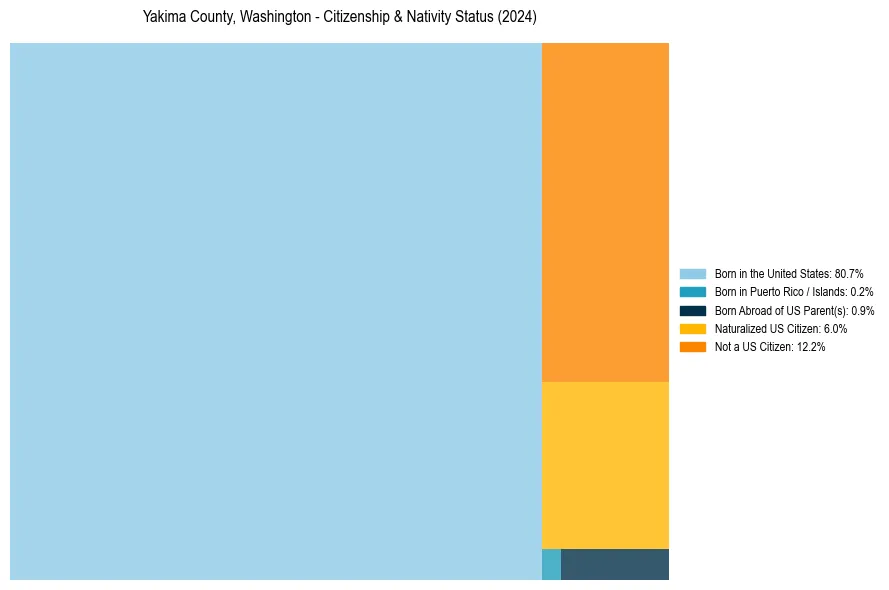
Yakima County, Washington Nativity & Citizenship Distribution
Yakima County, Washington Historical Nativity Trends (2010–2024)
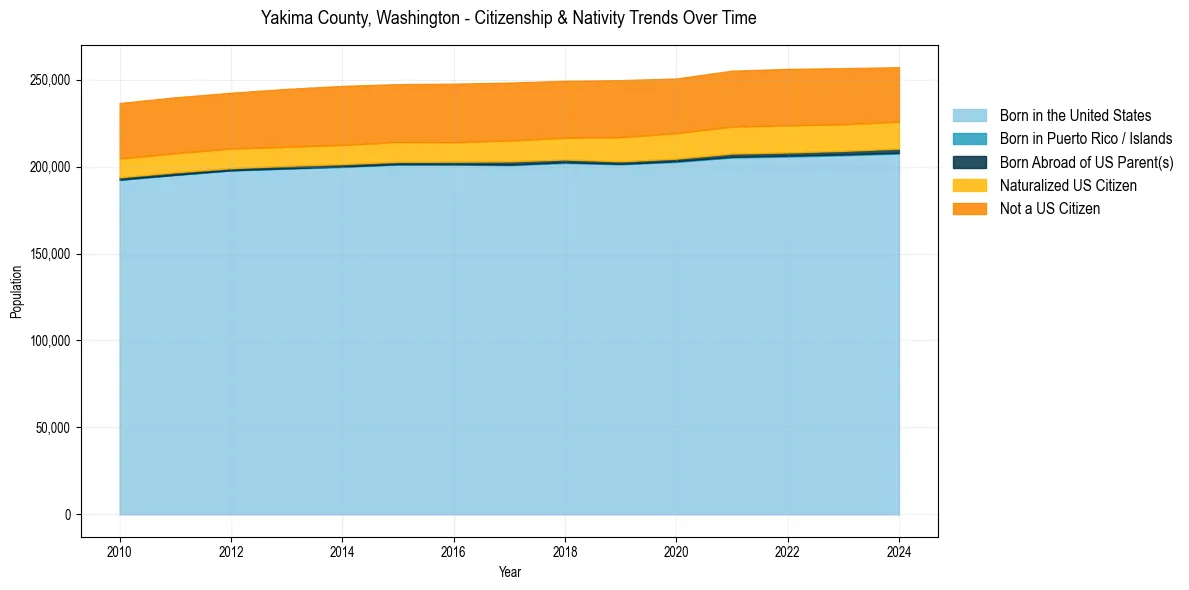
Yakima County, Washington Population & Nativity History
| Year | Total Pop | Foreign Born | Native Born |
|---|---|---|---|
| 2024 | 257,152 | 18.2% | 81.8% |
| 2023 | 256,605 | 18.5% | 81.5% |
| 2022 | 256,143 | 18.7% | 81.3% |
| 2021 | 255,151 | 18.7% | 81.3% |
| 2020 | 250,649 | 18.4% | 81.6% |
| 2019 | 249,697 | 18.7% | 81.3% |
| 2018 | 249,325 | 18.1% | 81.9% |
| 2017 | 248,279 | 18.2% | 81.8% |
| 2016 | 247,681 | 18.1% | 81.9% |
| 2015 | 247,408 | 18.1% | 81.9% |
| 2014 | 246,402 | 18.3% | 81.7% |
| 2013 | 244,654 | 18.1% | 81.9% |
| 2012 | 242,454 | 17.9% | 82.1% |
| 2011 | 239,836 | 18.0% | 82.0% |
| 2010 | 236,542 | 18.0% | 82.0% |
Nativity & Citizenship FAQs for Yakima County, Washington
Approximately 18.2% of residents in Yakima County, Washington were born outside the United States.
The vast majority of residents, roughly 87.8%, are U.S. citizens (including both native-born and naturalized citizens).