Washington County, Wisconsin Nativity & Citizenship Status (2024)
Place of birth and citizenship status analysis for Washington County, Wisconsin
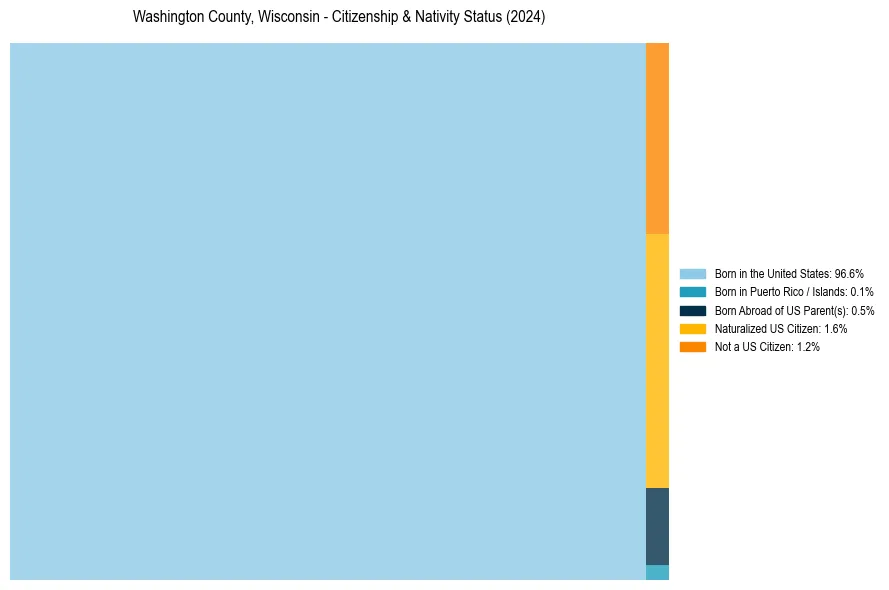
Washington County, Wisconsin Nativity & Citizenship Indicators (2024)
Native Born
97.1%
Foreign Born
2.9%
Naturalized
1.6%
US Citizens
98.8%
Washington County, Wisconsin Nativity & Citizenship Distribution
Washington County, Wisconsin Historical Nativity Trends (2010–2024)
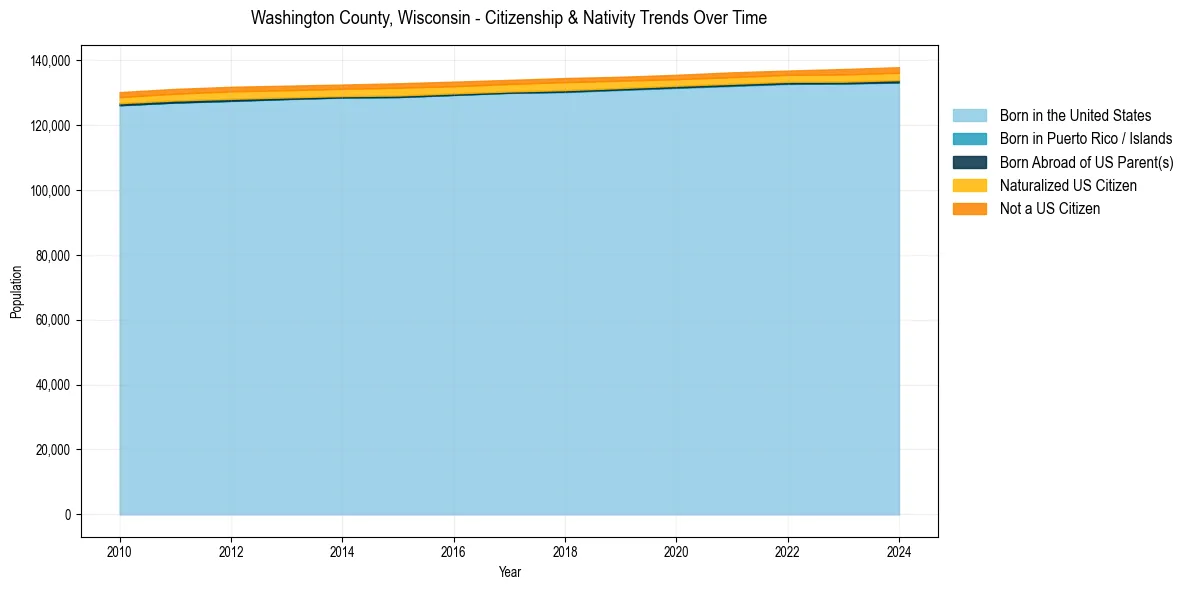
Washington County, Wisconsin Population & Nativity History
| Year | Total Pop | Foreign Born | Native Born |
|---|---|---|---|
| 2024 | 137,879 | 2.9% | 97.1% |
| 2023 | 137,320 | 2.8% | 97.2% |
| 2022 | 136,842 | 2.5% | 97.5% |
| 2021 | 136,300 | 2.6% | 97.4% |
| 2020 | 135,529 | 2.5% | 97.5% |
| 2019 | 134,925 | 2.6% | 97.4% |
| 2018 | 134,535 | 2.8% | 97.2% |
| 2017 | 133,967 | 2.7% | 97.3% |
| 2016 | 133,422 | 2.7% | 97.3% |
| 2015 | 132,921 | 2.8% | 97.2% |
| 2014 | 132,526 | 2.7% | 97.3% |
| 2013 | 132,186 | 2.7% | 97.3% |
| 2012 | 131,840 | 2.8% | 97.2% |
| 2011 | 131,190 | 2.7% | 97.3% |
| 2010 | 130,206 | 2.6% | 97.4% |
Nativity & Citizenship FAQs for Washington County, Wisconsin
Approximately 2.9% of residents in Washington County, Wisconsin were born outside the United States.
The vast majority of residents, roughly 98.8%, are U.S. citizens (including both native-born and naturalized citizens).