US ZIP Code 30238 Race & Ethnicity Demographics (2024)
Racial distribution and diversity statistics for US ZIP Code 30238
US ZIP Code 30238 Diversity Indicators (2024)
Total Population
43,191
Diversity Score
44.7
Diversity Tier
Moderate
Largest Group
Black / African American
72.3%%
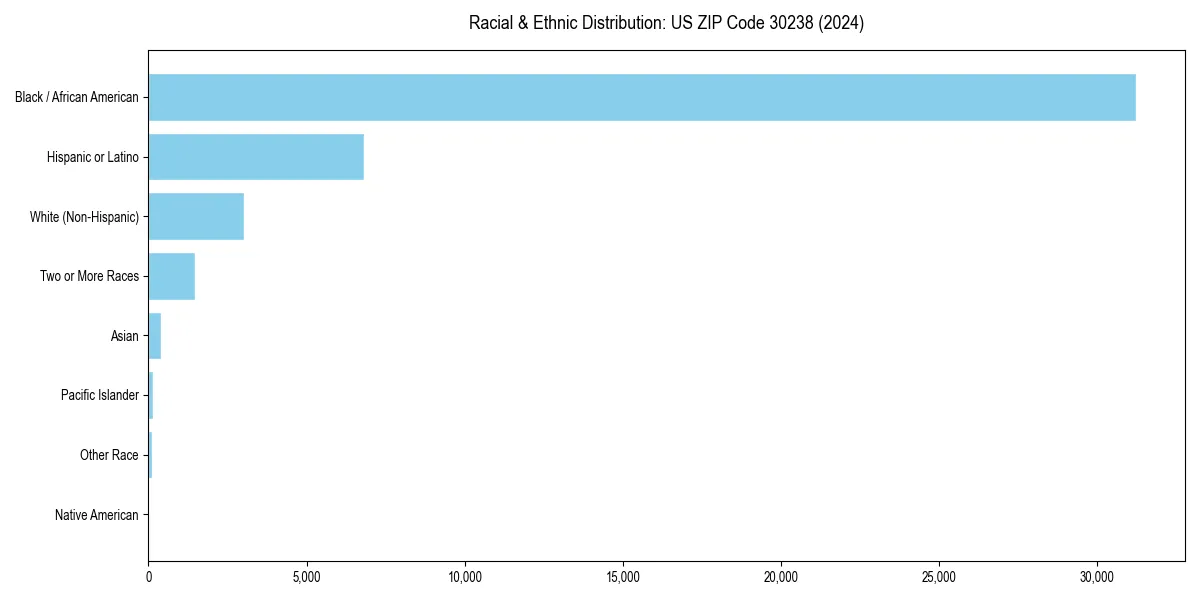
US ZIP Code 30238 Racial & Ethnic Breakdown
US ZIP Code 30238 Historical Diversity Trend (2021–2024)
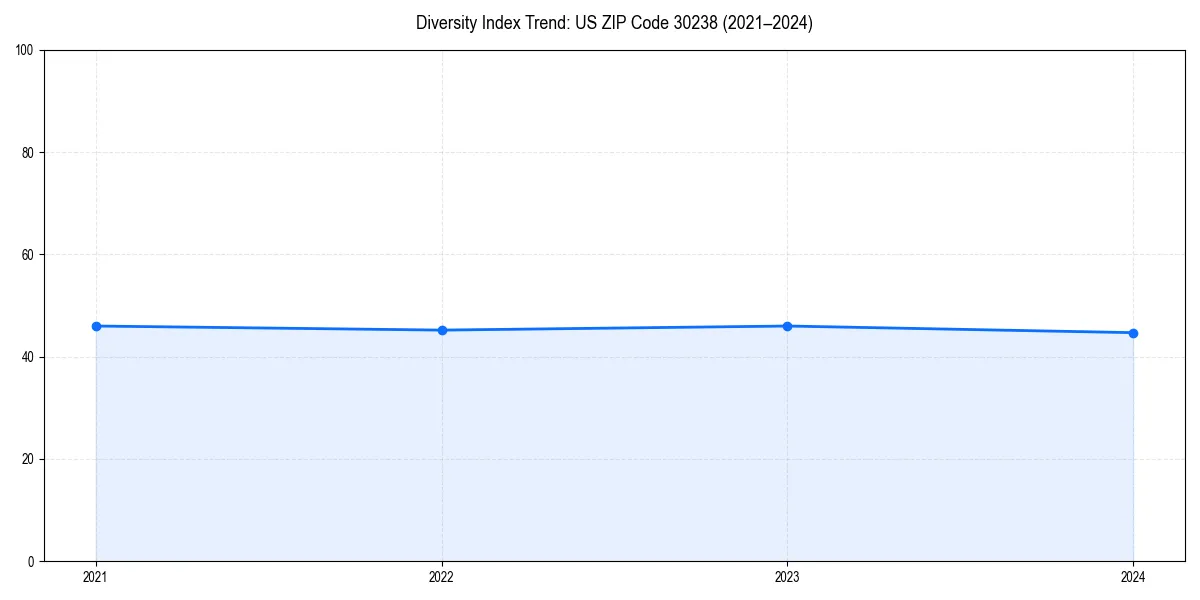
Since 2021, the diversity index of US ZIP Code 30238 has decreased.
US ZIP Code 30238 Population by Race & Ethnicity
| Race / Ethnicity | Population | Percentage |
|---|---|---|
| Black / African American | 31,207 | 72.3% |
| Hispanic or Latino | 6,828 | 15.8% |
| White (Non-Hispanic) | 3,032 | 7.0% |
| Two or More Races | 1,477 | 3.4% |
| Asian | 381 | 0.9% |
| Pacific Islander | 134 | 0.3% |
| Other Race | 124 | 0.3% |
| Native American | 8 | 0.0% |
Diversity & Demographics FAQs for US ZIP Code 30238
The largest racial or ethnic group in US ZIP Code 30238 is Black / African American, which makes up 72.3% of the total population.
Since 2021, the diversity index for US ZIP Code 30238 has decreased. The area currently has a diversity score of 44.7/100, which is considered a Moderate level of diversity.