2023 US ZIP Code 50401 Demographics | Comprehensive Overview
Data and insights for US ZIP Code 50401, including population, age & gender distribution, race & ethnicity, median & household income distribution, property value distribution, educational attainment, health insurance coverage, nativity & citizenship, commuting & transportation, employment, veteran service, poverty & income and SNAP/food stamp recipients. Based on 2023 American Community Survey Estimates.
US ZIP Code 50401 Key Demographic Statistics (2023 Estimates)
Key demographic statistics summarized from the U.S. Census Bureau's 2023 American Community Survey (ACS).
Source: U.S. Census Bureau, 2023 American Community Survey (ACS) Estimates
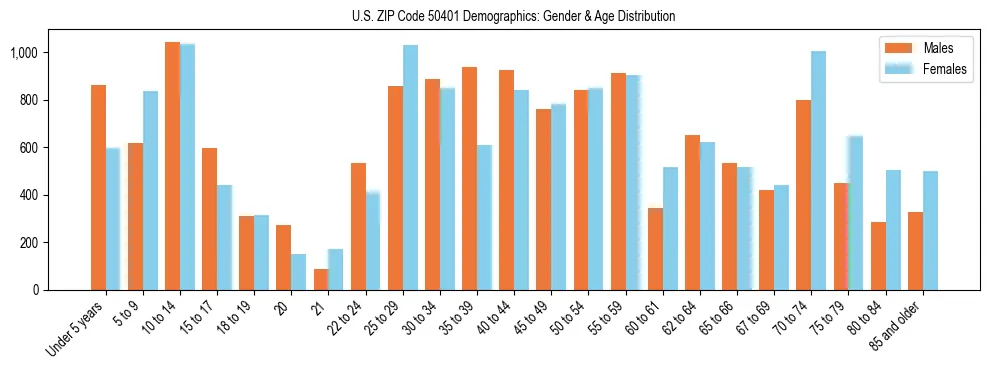
US ZIP Code 50401 Demographics: Age & Gender Distribution (2023)
Key Demographic Indicators for US ZIP Code 50401
The following statistics highlight US ZIP Code 50401 population and median age, based on U.S. Census Bureau 2023 ACS Estimates.
- Total Population
- 28,818
- Median Age (Total)
- 42.5 years
- Median Age (Male)
- 40.7 years
- Median Age (Female)
- 45.0 years
US ZIP Code 50401 Age Distribution Comparison with Cerro Gordo County, Iowa 2023
Compare US ZIP Code 50401 age demographics with Cerro Gordo County, Iowa to understand regional demographic patterns.
| Metric | US ZIP Code 50401 | Cerro Gordo County, Iowa | Difference |
|---|---|---|---|
| Median Age | 42.5 yrs | 43.9 yrs | -1.4 yrs |
| Under 5 years | 5.05% | 5.32% | -0.3pp |
| Children (5–17 years) | 15.86% | 15.63% | +0.2pp |
| Young Adults (18–24) | 7.81% | 7.44% | +0.4pp |
| Middle-aged (35–54) | 22.70% | 22.09% | +0.6pp |
| Seniors (65+) | 22.30% | 23.01% | -0.7pp |
| Total Dependency Ratio | 76.08 | 78.45 | -2.4 |
Note: "pp" indicates percentage points. "yrs" indicates years. The dependency ratio measures the burden on working-age population (18-64) to support dependents (under 18 and 65+).
Dependency Ratios Analysis
- Total Dependency Ratio
- 76.08
- Youth Dependency Ratio
- 36.82 Population under 18 relative to working age (18-64).
- Old-Age Dependency Ratio
- 39.26 Population 65+ relative to working age (18-64).
A higher ratio indicates a greater financial and social burden on the working population to support non-working age groups.
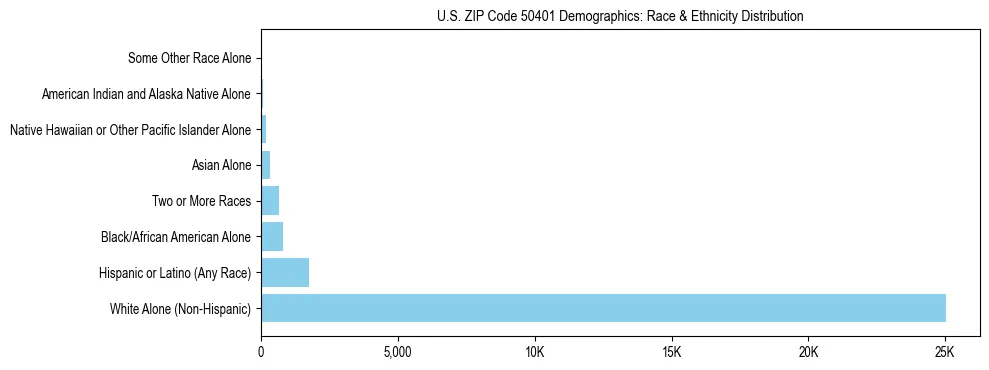
US ZIP Code 50401 Demographics: Racial and Ethnic Composition (2023)
Diversity & Cultural Composition of US ZIP Code 50401
The racial makeup and ethnic composition of US ZIP Code 50401 are detailed below, drawing from the U.S. Census Bureau's 2023 ACS Estimates.
- Diversity Index Score
- 24.10
- Diversity Tier
- low
- Definition
- The probability that two individuals chosen at random will be from different racial or ethnic groups.
Diversity Comparison with Cerro Gordo County, Iowa
Compare US ZIP Code 50401 racial and ethnic demographics with Cerro Gordo County, Iowa to understand regional diversity patterns.
US ZIP Code 50401 Diversity
24.10
lowCerro Gordo County, Iowa Diversity
20.60
lowRacial and Ethnic Composition Comparison
| Racial/Ethnic Group | US ZIP Code 50401 | Cerro Gordo County, Iowa | Difference |
|---|---|---|---|
| White Alone (Non-Hispanic) | 86.82% | 88.89% | -2.1pp |
| Hispanic or Latino (Any Race) | 6.12% | 5.45% | +0.7pp |
| Black/African American Alone | 2.75% | 1.94% | +0.8pp |
| Two or More Races | 2.28% | 1.92% | +0.4pp |
| Asian Alone | 1.17% | 1.21% | -0.0pp |
| Native Hawaiian or Other Pacific Islander Alone | 0.58% | 0.39% | +0.2pp |
| American Indian and Alaska Native Alone | 0.23% | 0.16% | +0.1pp |
| Some Other Race Alone | 0.05% | 0.04% | +0.0pp |
| Diversity Index Score | 24.10 | 20.60 | +3.5 |
Note: "pp" indicates percentage points. Higher Diversity Index Scores (green) indicate greater racial/ethnic diversity.
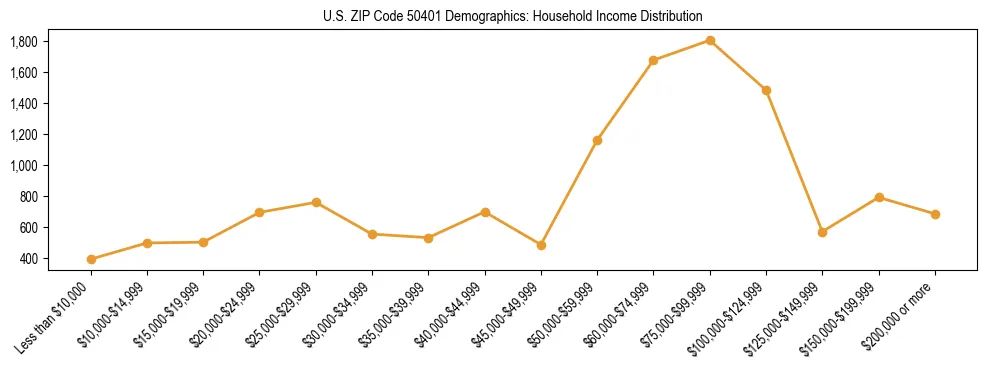
US ZIP Code 50401 Economic Demographics: Household Income Statistics (2023)
Economic Snapshot for US ZIP Code 50401
The following data illustrates the financial landscape of US ZIP Code 50401, based on the latest U.S. Census Bureau 2023 ACS Estimates.
- Median Household Income
- $63,807 (Adjusted for inflation)
- Total Households Analyzed
- 13,298
Income Comparison with Cerro Gordo County, Iowa
Compare US ZIP Code 50401 household income with Cerro Gordo County, Iowa to understand regional economic patterns.
US ZIP Code 50401
$63,807
Cerro Gordo County, Iowa
$65,537
Income Distribution Comparison
| Income Bracket | US ZIP Code 50401 | Cerro Gordo County, Iowa | Difference |
|---|---|---|---|
| Less than $20,000 | 10.48% | 10.54% | -0.1pp |
| $20,000 to $34,999 | 15.12% | 14.47% | +0.6pp |
| $35,000 to $49,999 | 12.92% | 12.81% | +0.1pp |
| $50,000 to $74,999 | 21.34% | 19.92% | +1.4pp |
| $75,000 to $149,999 | 29.03% | 28.30% | +0.7pp |
| $150,000 or more | 11.11% | 13.96% | -2.9pp |
Note: "pp" indicates percentage points. Higher percentages in high-income brackets (green) indicate greater affluence compared to Cerro Gordo County, Iowa.
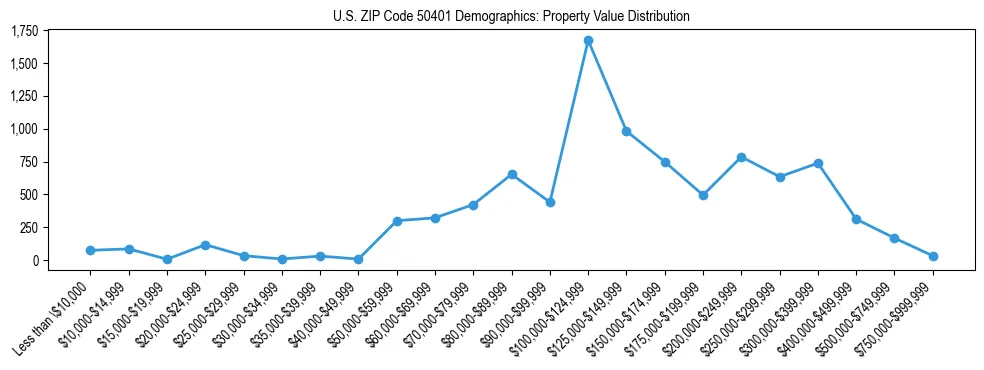
US ZIP Code 50401 Real Estate Demographics: Property Values (2023)
Real Estate Market Snapshot for US ZIP Code 50401
The following data highlights the distribution of owner-occupied housing values in US ZIP Code 50401, based on the latest U.S. Census Bureau 2023 ACS Estimates.
- Median Property Value
- $134,100
- Total Properties Analyzed
- 9,074 (Owner-occupied units)
Property Value Comparison with Cerro Gordo County, Iowa
Compare US ZIP Code 50401 property values with Cerro Gordo County, Iowa to understand regional real estate market patterns.
US ZIP Code 50401
$134,100
Cerro Gordo County, Iowa
$154,100
Property Value Distribution Comparison
| Value Bracket | US ZIP Code 50401 | Cerro Gordo County, Iowa | Difference |
|---|---|---|---|
| Less than $25,000 | 3.15% | 4.52% | -1.4pp |
| $25,000 to $49,999 | 0.90% | 2.10% | -1.2pp |
| $50,000 to $99,999 | 23.57% | 18.40% | +5.2pp |
| $100,000 to $199,999 | 42.94% | 37.52% | +5.4pp |
| $200,000 to $499,999 | 27.22% | 31.25% | -4.0pp |
| $500,000 to $999,999 | 2.22% | 5.75% | -3.5pp |
| $1,000,000 or more | 0.00% | 0.47% | -0.5pp |
Note: "pp" indicates percentage points. Higher percentages in high-value brackets (green) indicate more expensive real estate compared to Cerro Gordo County, Iowa.
US ZIP Code 50401 Educational Attainment Statistics (2023)
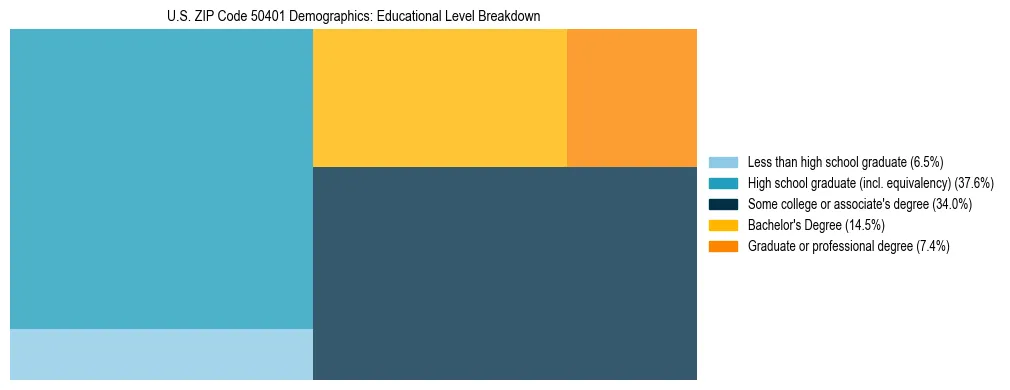
Education Snapshot for US ZIP Code 50401
The following statistics represent the educational background of residents aged 25 and older in US ZIP Code 50401, based on U.S. Census Bureau 2023 ACS Estimates.
- High School Graduate or Higher
- 93.55%
- Bachelor's Degree or Higher
- 21.93%
- Total Population Analyzed (25+)
- 20,542
Education Level Comparison with Cerro Gordo County, Iowa
Compare US ZIP Code 50401 educational attainment with Cerro Gordo County, Iowa to understand regional education patterns.
Bachelor's+ in US ZIP Code 50401
21.93%
Bachelor's+ in Cerro Gordo County, Iowa
24.26%
Detailed Education Level Comparison
| Education Level | US ZIP Code 50401 | Cerro Gordo County, Iowa | Difference |
|---|---|---|---|
| Less than HS | 6.45% | 5.53% | +0.9pp |
| HS Graduate | 37.59% | 35.87% | +1.7pp |
| Some College/Associate's | 34.03% | 34.34% | -0.3pp |
| Bachelor's Degree | 14.52% | 16.38% | -1.9pp |
| Graduate/Professional | 7.41% | 7.89% | -0.5pp |
| HS Graduate or Higher | 93.55% | 94.47% | -0.9pp |
Note: "pp" indicates percentage points. Higher percentages in advanced education levels (green badges) indicate higher educational attainment compared to Cerro Gordo County, Iowa.
US ZIP Code 50401 Health Insurance Coverage Statistics (2023)
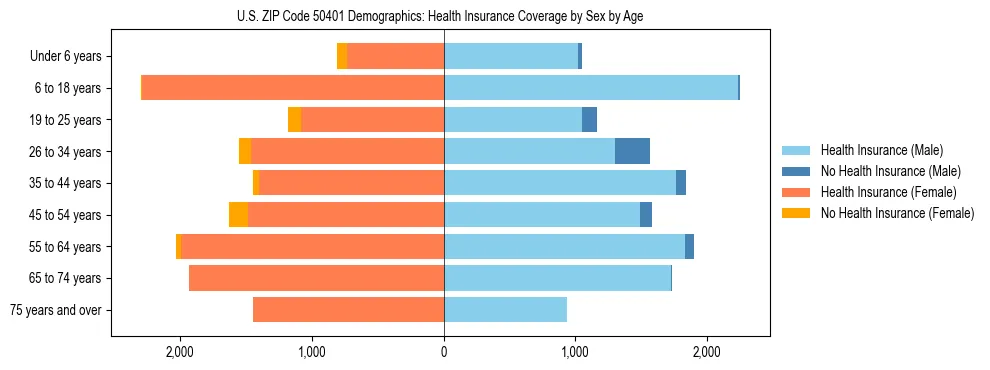
Healthcare Coverage Snapshot for US ZIP Code 50401
The following data illustrates the health coverage landscape of US ZIP Code 50401, based on U.S. Census Bureau 2023 ACS Estimates.
- Overall Uninsured Rate
- 4.2%
- Total Uninsured Population
- 1,178
- Total Civilian Population
- 28,325
The uninsured rates vary significantly by demographic group. Children under 18 and seniors aged 65+ generally have higher coverage rates due to public programs like Medicaid/CHIP and Medicare.
Health Insurance Coverage Comparison with Cerro Gordo County, Iowa
Compare US ZIP Code 50401 health insurance coverage with Cerro Gordo County, Iowa to understand regional healthcare access patterns.
Uninsured in US ZIP Code 50401
4.2%
Uninsured in Cerro Gordo County, Iowa
3.8%
Uninsured Rates by Age and Sex
| Age Group | US ZIP Code 50401 | Cerro Gordo County, Iowa | ||
|---|---|---|---|---|
| Male | Female | Male | Female | |
| Under 18 | 1.3% | 2.6% | 2.3% | 2.1% |
| 18-34 years | 14.0% | 6.9% | 12.4% | 5.7% |
| 35-64 years | 4.6% | 4.6% | 4.6% | 4.1% |
| 65+ years | 0.2% | 0.0% | 0.2% | 0.0% |
Note: Lower uninsured rates indicate better health insurance coverage. The 18-34 age group typically has the highest uninsured rates, while seniors 65+ have near-universal coverage through Medicare.
US ZIP Code 50401 Nativity & Citizenship Statistics (2023)
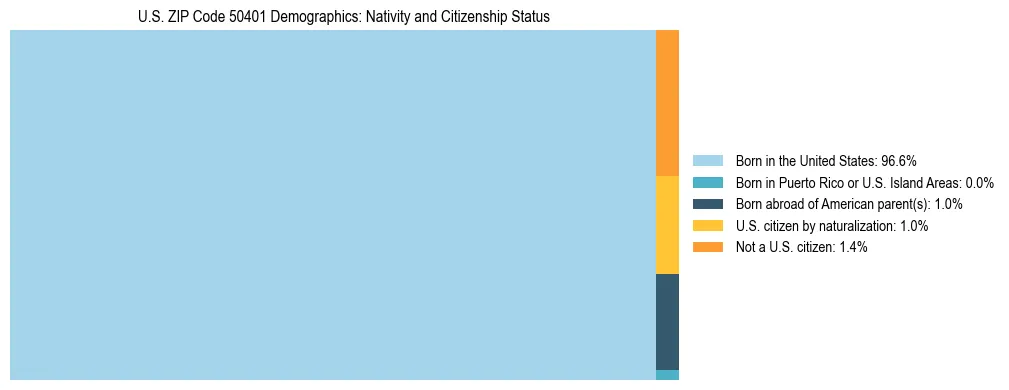
Citizenship Snapshot for US ZIP Code 50401
The following data details the citizenship status and nativity of the population in US ZIP Code 50401, based on U.S. Census Bureau 2023 ACS Estimates.
- U.S. Citizenship Rate
- 98.6% (Native-born + Naturalized)
- Naturalized Citizens
- 281 (Foreign-born individuals who acquired citizenship)
- Non-Citizen Residents
- 416
Citizenship Comparison with Cerro Gordo County, Iowa
Compare US ZIP Code 50401 citizenship and nativity with Cerro Gordo County, Iowa to understand regional immigration and naturalization patterns.
Citizenship in US ZIP Code 50401
98.6%
Citizenship in Cerro Gordo County, Iowa
98.8%
Nativity and Citizenship Comparison
| Nativity/Citizenship Status | US ZIP Code 50401 | Cerro Gordo County, Iowa | Difference |
|---|---|---|---|
| Born in the United States | 96.6% | 97.0% | -0.4pp |
| Born in PR or U.S. Territories | 0.0% | 0.1% | -0.1pp |
| Born abroad of American parent(s) | 1.0% | 0.8% | +0.2pp |
| U.S. citizen by naturalization | 1.0% | 1.0% | 0.0pp |
| Not a U.S. citizen | 1.4% | 1.2% | +0.2pp |
| Total U.S. Citizens | 98.6% | 98.8% | -0.2pp |
Note: "pp" indicates percentage points. Higher naturalization rates (green) indicate greater immigrant integration compared to Cerro Gordo County, Iowa.
US ZIP Code 50401 Commuting & Transportation Statistics (2023)
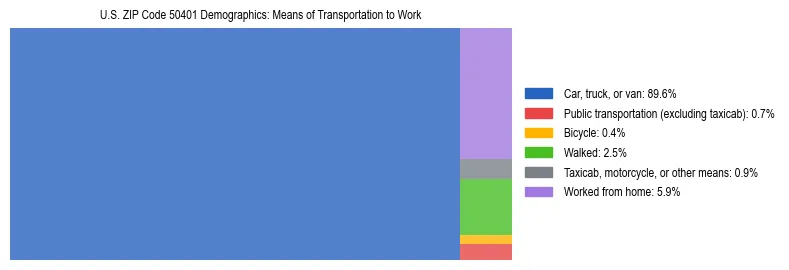
Commuter Snapshot for US ZIP Code 50401
The following data details the commuting habits of the workforce in US ZIP Code 50401, based on U.S. Census Bureau 2023 ACS Estimates.
- Drove to Work (Car/Truck/Van)
- 89.6%
- Public Transportation Usage
- 0.7%
- Work From Home Rate
- 5.9%
- Total Workers Analyzed
- 14,788
Transportation Comparison with Cerro Gordo County, Iowa
Compare US ZIP Code 50401 commuting patterns with Cerro Gordo County, Iowa to understand regional transportation preferences.
Drove in US ZIP Code 50401
89.6%
Drove in Cerro Gordo County, Iowa
88.1%
Commute Mode Comparison
| Transportation Method | US ZIP Code 50401 | Cerro Gordo County, Iowa | Difference |
|---|---|---|---|
| Car, truck, or van | 89.6% | 88.1% | +1.5pp |
| Public transportation | 0.7% | 0.6% | +0.1pp |
| Bicycle | 0.4% | 0.3% | +0.1pp |
| Walked | 2.5% | 2.3% | +0.2pp |
| Taxicab, motorcycle, or other | 0.9% | 0.9% | 0.0pp |
| Worked from home | 5.9% | 7.8% | -1.9pp |
Note: "pp" indicates percentage points. Higher public transit or work-from-home rates (green) indicate more diverse commuting options compared to Cerro Gordo County, Iowa.
US ZIP Code 50401 Employment by Class of Worker (2023)
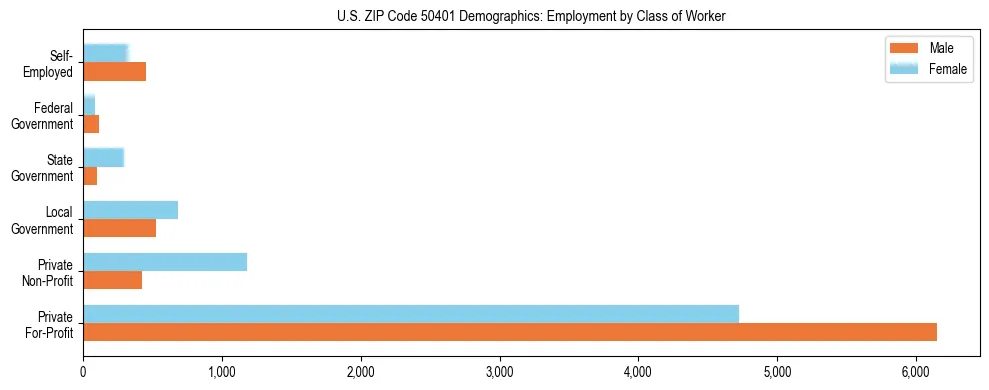
Workforce Snapshot for US ZIP Code 50401
The following statistics categorize the civilian employed population aged 16 and over in US ZIP Code 50401 by their employment sector, based on U.S. Census Bureau 2023 ACS Estimates.
- Total Employed Civilian Population
- 15,069
- Private Sector (Profit & Non-Profit)
- Includes For-Profit and Non-Profit organizations
- Government Workers
- Includes Local, State, and Federal employees
- Self-Employed Workers
- Includes own not incorporated business workers
Employment Sector Comparison with Cerro Gordo County, Iowa
Compare US ZIP Code 50401 employment patterns with Cerro Gordo County, Iowa to understand regional workforce composition differences.
Government Employment in US ZIP Code 50401
4.9% (M) / 7.1% (F)
Government Employment in Cerro Gordo County, Iowa
4.7% (M) / 7.6% (F)
Employment Sector Comparison
| Employment Sector | US ZIP Code 50401 | Cerro Gordo County, Iowa | Difference |
|---|---|---|---|
| Private For-Profit (Combined) | M: 40.8% F: 31.3% | M: 39.6% F: 31.2% | M: +1.2pp F: +0.1pp |
| Private Non-Profit | M: 2.8% F: 7.8% | M: 2.7% F: 7.9% | M: +0.1pp F: -0.1pp |
| Government (All Levels) | M: 4.9% F: 7.1% | M: 4.7% F: 7.6% | M: +0.2pp F: -0.5pp |
| Self-Employed | M: 3.0% F: 2.2% | M: 4.0% F: 2.1% | M: -1.0pp F: +0.1pp |
Note: "pp" indicates percentage points. M = Male, F = Female. Green badges indicate higher government employment compared to Cerro Gordo County, Iowa.
Definitions: "Private sector" includes employees of for-profit and non-profit companies. "Government" includes all local, state, and federal employees. "Self-employed" refers to those operating their own unincorporated businesses.
US ZIP Code 50401 Veteran Population & Service Statistics (2023)
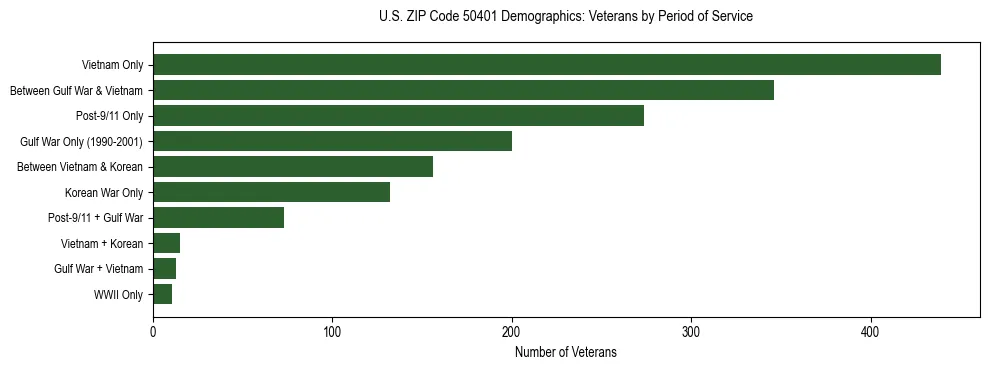
Veteran Community Snapshot for US ZIP Code 50401
The following data details the civilian veteran population aged 18 and over in US ZIP Code 50401, based on U.S. Census Bureau 2023 ACS Estimates.
- Total Civilian Veterans
- 1,665
- Primary Service Era
- Vietnam Era Only
439 veterans (26.4%)
Veteran Population Comparison with Cerro Gordo County, Iowa
Compare US ZIP Code 50401 veteran demographics with Cerro Gordo County, Iowa to understand regional veteran service patterns.
Total Veterans in US ZIP Code 50401
1,665
Total Veterans in Cerro Gordo County, Iowa
2,463
- US ZIP Code 50401: Vietnam Era Only (26.4%)
- Cerro Gordo County, Iowa: Vietnam Era Only (29.8%)
Service Period Distribution Comparison
| Service Period | US ZIP Code 50401 | Cerro Gordo County, Iowa | Difference |
|---|---|---|---|
| Vietnam Era Only | 26.4% (439) | 29.8% (734) | -3.4pp |
| Between Gulf War & Vietnam | 20.8% (346) | 18.7% (460) | +2.1pp |
| Post-9/11 Only | 16.5% (274) | 17.3% (427) | -0.8pp |
| Gulf War Only | 12.0% (200) | 9.8% (242) | +2.2pp |
| Between Vietnam & Korean | 9.4% (156) | 9.7% (239) | -0.3pp |
| Korean War Only | 7.9% (132) | 8.3% (205) | -0.4pp |
| Post-9/11 + Gulf War | 4.4% (73) | 3.0% (73) | +1.4pp |
| Vietnam + Korean | 0.9% (15) | 0.6% (15) | +0.3pp |
| Gulf War + Vietnam | 0.8% (13) | 0.5% (13) | +0.3pp |
| WWII Only | 0.7% (11) | 1.3% (32) | -0.6pp |
| Post-9/11 + Gulf War + Vietnam | 0.4% (6) | 0.3% (7) | +0.1pp |
Note: "pp" indicates percentage points. Comparisons show relative proportions of veteran populations by service era.
Note: Periods of service include World War II (Dec 1941–Dec 1946), Korean War (Jul 1950–Jan 1955), Vietnam Era (Aug 1964–Apr 1975), Gulf War (Aug 1990–Aug 2001), and Post-9/11 (Sept 2001 or later). Veterans may have served in multiple eras.
US ZIP Code 50401 Family Poverty & Income Statistics (2023)
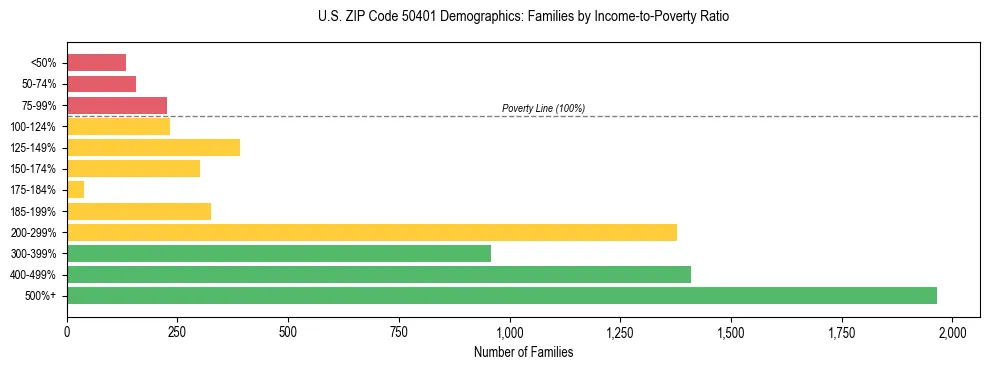
Family Economic Security Snapshot for US ZIP Code 50401
The following data categorizes families in US ZIP Code 50401 by their income relative to the federal poverty threshold, based on U.S. Census Bureau 2023 ACS Estimates.
- Families Below Poverty Line (<100%)
- 6.9% (516 families)
- Families Near Poverty (100-199%)
- 35.5% (2,668 families)
- Families with Secure Income (200%+)
- 57.6% (4,332 families)
Poverty Rate Comparison with Cerro Gordo County, Iowa
Compare US ZIP Code 50401 poverty levels with Cerro Gordo County, Iowa to understand regional economic disparities.
Poverty Rate in US ZIP Code 50401
6.9%
Below poverty linePoverty Rate in Cerro Gordo County, Iowa
5.5%
Below poverty lineIncome-to-Poverty Ratio Distribution Comparison
| Income Category | US ZIP Code 50401 | Cerro Gordo County, Iowa | Difference |
|---|---|---|---|
| Below Poverty (<100%) | 6.9% (516) | 5.5% (612) | +1.4pp |
| Near Poverty (100-199%) | 35.5% (2,668) | 33.2% (3,723) | +2.3pp |
| Economic Security (200%+) | 57.6% (4,332) | 61.4% (6,894) | -3.8pp |
| Detailed Breakdown | |||
| Below 50% of Poverty | 1.8% | 1.6% | +0.2pp |
| 50-74% of Poverty | 2.1% | 1.5% | +0.6pp |
| 75-99% of Poverty | 3.0% | 2.3% | +0.7pp |
| 100-124% of Poverty | 3.1% | 2.9% | +0.2pp |
| 125-149% of Poverty | 5.2% | 4.3% | +0.9pp |
| 150-174% of Poverty | 4.0% | 4.9% | -0.9pp |
Note: "pp" indicates percentage points. Red badges indicate higher poverty; green badges indicate lower poverty compared to Cerro Gordo County, Iowa.
Definition: The "Income-to-Poverty Ratio" measures a family's income against the federal poverty threshold. A ratio below 1.00 means the family is in poverty. Ratios between 1.00 and 1.99 indicate low income ("near poverty"), while ratios of 2.00 or higher suggest greater economic security.
US ZIP Code 50401 SNAP/Food Stamps Statistics (2023)
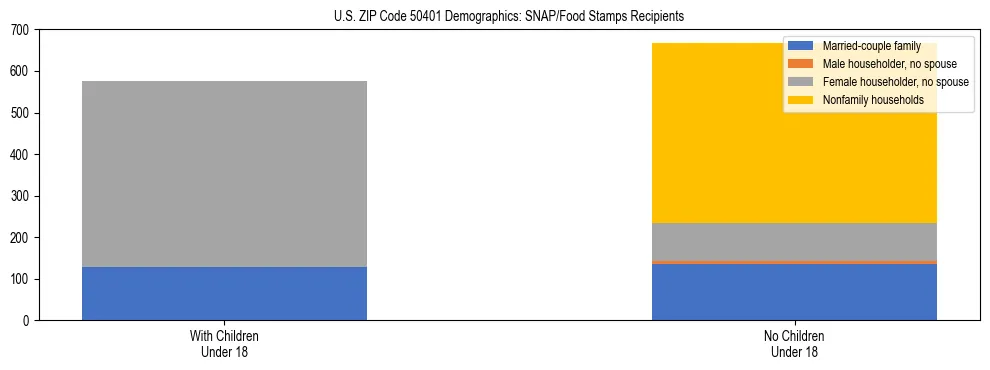
SNAP Participation Snapshot for US ZIP Code 50401
The following data details household participation in the Supplemental Nutrition Assistance Program (SNAP) in US ZIP Code 50401, based on U.S. Census Bureau 2023 ACS Estimates.
- Total Households Receiving SNAP
- 1,244 (9.35% of all households)
- Recipient Households with Children
- 577 (46.38% of recipients)
- Total Households Analyzed
- 13,298
SNAP Participation Comparison with Cerro Gordo County, Iowa
Compare US ZIP Code 50401 SNAP participation with Cerro Gordo County, Iowa to understand regional food assistance needs.
SNAP Participation in US ZIP Code 50401
9.35%
1,244 householdsSNAP Participation in Cerro Gordo County, Iowa
9.11%
1,769 householdsSNAP Household Composition Comparison
| Household Type | US ZIP Code 50401 | Cerro Gordo County, Iowa | ||
|---|---|---|---|---|
| With Children | No Children | With Children | No Children | |
| Married-Couple Family | 10.21% (127) | 10.85% (135) | 10.68% (189) | 8.65% (153) |
| Male Householder, No Spouse | 0.00% (0) | 0.64% (8) | 0.51% (9) | 1.07% (19) |
| Female Householder, No Spouse | 36.17% (450) | 7.40% (92) | 26.68% (472) | 5.82% (103) |
| Nonfamily Households | 0.00% (0) | 34.73% (432) | 0.00% (0) | 46.58% (824) |
| Total SNAP Recipients | 1,244 (9.35% of households) | 1,769 (9.11% of households) | ||
Note: Percentages represent the share of SNAP-receiving households in each category. Higher percentages in households with children often indicate targeting of families with greater nutritional needs.
About this data: The Supplemental Nutrition Assistance Program (SNAP) provides food assistance to low-income families. Households with children often face higher participation rates due to eligibility guidelines prioritizing child nutrition. "Nonfamily households" typically refer to individuals living alone or with unrelated roommates.